

Is There an AI Premium on Exit Multiples?

Something is clearly being repriced. What almost nobody credible will do is put a single number on it, and that reluctance tells you a good deal about the state of the evidence.
Go looking for whether there is an AI premium on exit multiples and the published answers run from a modest uplift to several times the comparable figure. They cannot all be correct. They are also less in conflict than they look, because each one measures a different sample, at a different stage, in a different layer of the stack, working from its own idea of what makes a company an AI company in the first place.
This post adds no new number to that pile. It works through what the evidence will support, where the causation probably sits, and which parts of it a founder can move.
What the evidence supports
The two most thorough published analyses of AI dealmaking are worth starting with, mostly for what they leave out. BCG's 2026 M&A Report chapter on AI deals works from 41,149 majority technology acquisitions since 2020, 11,372 of them linked to the AI ecosystem. Nowhere in it will you find an EV/revenue multiple, an acquisition premium, or a comparison between AI and non-AI deal pricing. Over at McKinsey, the February 2026 note on technology M&A describes energy-efficient data centres and AI-optimised hardware attracting premium valuations, then stops short of saying by how much.
Two of the best-resourced research teams anywhere looked hard at this and published no premium figure. We read that as a considered answer to a measurement problem, and as a fair guide to how much weight any single figure deserves.
The market is certainly repricing AI exposure, and that part can be measured. Meritech's Software Pulse tracks a cohort of public software companies with clear AI tailwinds that is up 199% since January 2024, against an index sitting roughly flat across the same window. Whether that amounts to a premium on the label is a different question.
Where the causation probably sits
One finding reframed this for us. Meritech compared public software companies holding similar Rule of 40 scores but different mixes of growth and margin. The faster-growing group reached a median 11.8x EV to implied ARR. The slower-growing group, carrying higher free cash flow margins, sat at 4.4x. Same headline score, roughly two and a half times the multiple.
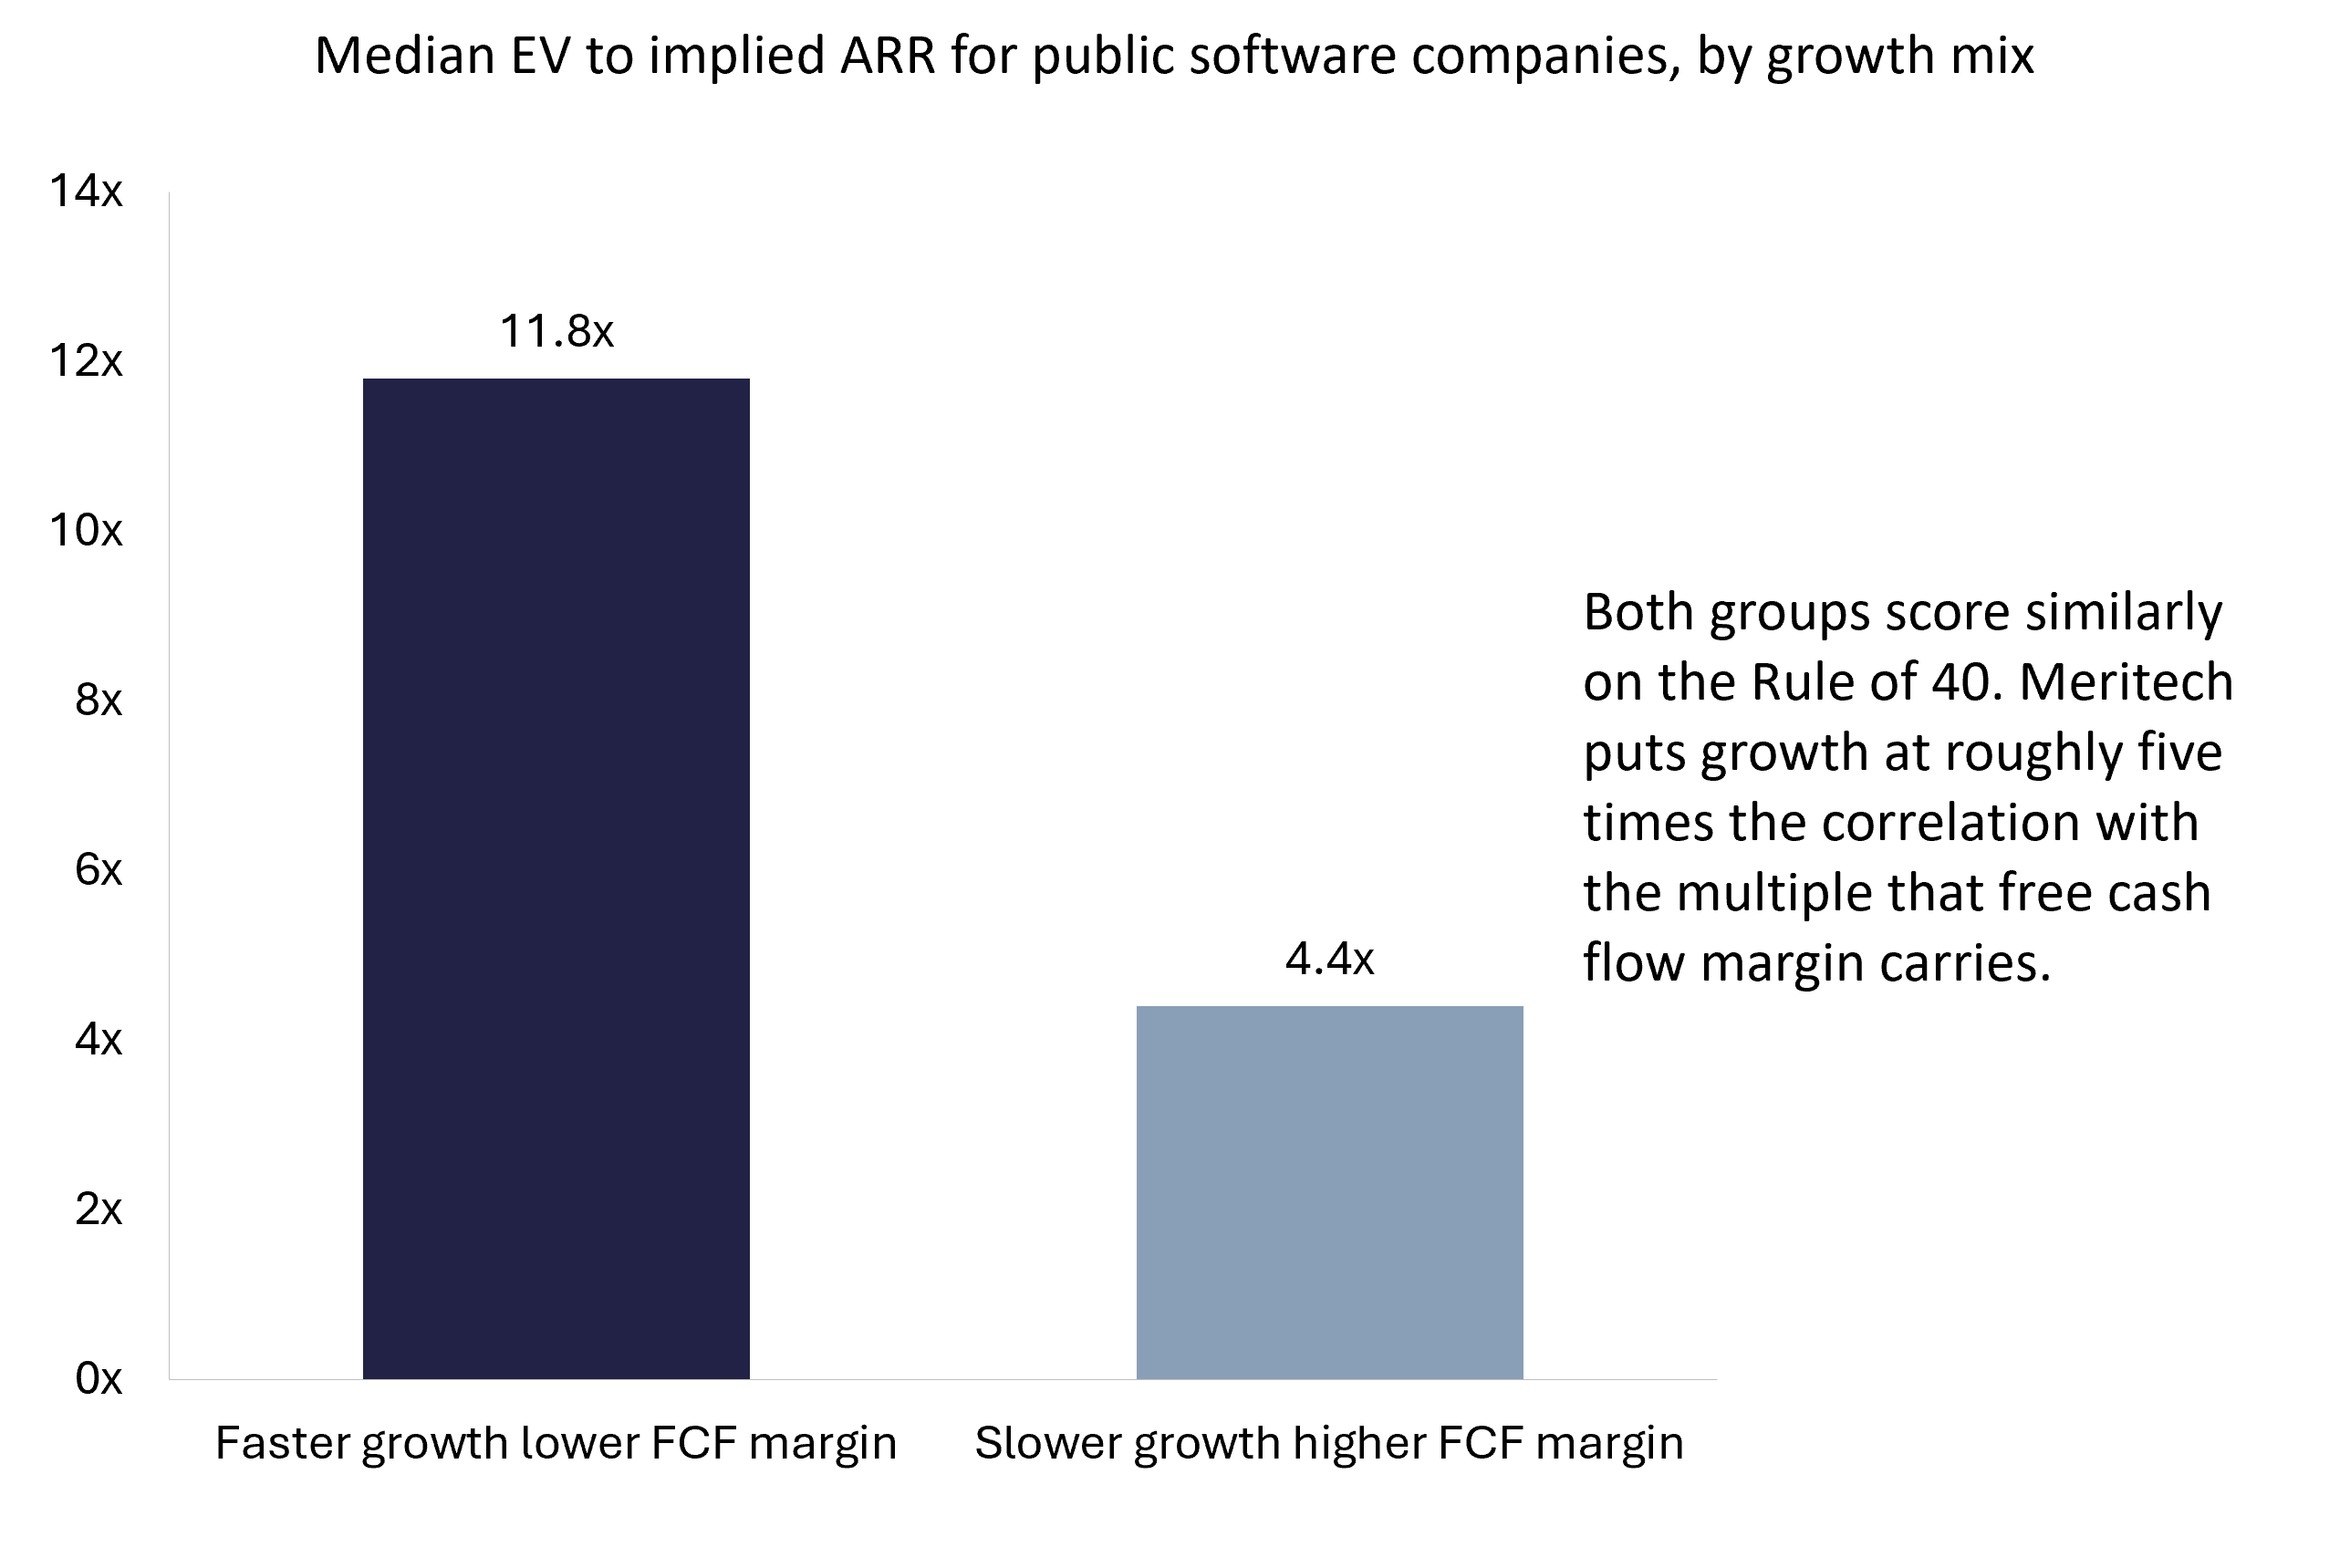
Meritech also puts growth at roughly five times the correlation with the multiple that free cash flow margin carries. Which gives a fairly uncomfortable hypothesis for anyone selling an AI story: a good deal of what gets reported as an AI premium may be a growth premium wearing a newer label. AI companies in these samples tend to be growing faster. Faster growth attracts a higher multiple whether or not anyone says the word AI.
The premium is hardly imaginary, though. Scarcity counts, and BCG notes that assets sitting at genuine chokepoints reprice in months, not years. What changes is where a founder puts the effort, since growth is movable and a label is not.
The distinction cashes out in practice. A buyer paying for the AI designation is a buyer whose mind you change with positioning, and the work becomes a messaging exercise. A buyer paying for a growth rate that happens to be driven by AI wants something operational that took quarters to build and survives diligence. Experienced acquirers separate those two quickly, which is why the second version holds up through a process and the first often falls apart in week three.
The funding side offers a cross-check. Carta's cap-table data put the median Series A pre-money valuation near $300m for AI foundational model companies in Q1 2026, against roughly $55m for everything else. Private investors are plainly pricing AI exposure. How much of that carries across into what a trade buyer will pay for a whole company has always been the open question, and it is a different calculation.
Why the published figures disagree so much
Five choices sit behind any premium figure, and each can move the answer on its own.

Classification alone swamps most premium claims. Take Aswath Damodaran's NYU Stern dataset from January 2026: US listed Software (System & Application) sits at 11.41x EV to sales across 309 firms, while Software (Internet) comes in at 9.56x across 29, and Computer Services manages 1.48x across 64. A lot of companies could sit under more than one of those headings, and whoever files them is choosing somewhere between 1.5x and 15.7x. Nobody has said the word AI yet.

Layer matters as much. In BCG's mid-2026 M&A analysis, infrastructure-layer assets such as data centres, compute and power command extraordinary valuations, while pricing at the application layer settles toward clearer benchmarks. Average a premium figure across both and you have described two markets at once, badly.
What buyers are paying for
What makes BCG's taxonomy useful is that it sorts deals by rationale instead of by sector label. Two categories swamp the rest: 4,394 of the AI-ecosystem acquisitions between 2020 and August 2026 were capability buying, another 2,653 were product expansion, and together those two are 95% of everything in the sample. Platform assembly, which is what most people write about, got to 67 deals in early 2026 from 26 in 2020. Horizontal consolidation managed 23 deals across six years. Call it 0.3%.

Read that distribution and the pricing logic follows. A capability purchase is a buyer deciding it is faster to buy a working team and a working product than build one. So what gets underwritten is whether the capability transfers. Documentation, contracts that assign, the questions in our due diligence checklist for buyers: those carry the weight, and the sector label carries very little of it.
The direction of travel in that dataset repays a second look. Capability buying slipped from 63% to 57% of annual volume across the period while platform assembly climbed from 3% to 9%. BCG also found non-AI buyers outnumbering AI-ecosystem buyers roughly two to one for AI targets, with 3,982 AI companies bought by firms outside the ecosystem altogether. Your buyer may well be an established company in a different sector, pricing you against its own comparables and not against venture benchmarks at all.
Volume supports the same reading, with CB Insights counting 266 AI M&A deals in Q1 2026, a 90% increase on the year. That is a lot of buyers acquiring a lot of capability, almost none of it anywhere near the headlines.
The premium often shows up as structure
This one catches founders out. Buyer and seller who cannot agree on value will usually bridge the gap with terms and leave the price alone. Earn-outs, contingent value rights, stepwise stakes, joint ventures: BCG has all of them doing that job through 2026.
Transaction data points the same way. On Fasken's summary of the 2026 SRS Acquiom study, earn-outs featured in 24% of 2025 deals, median earn-out potential 34% of the closing payment. Which means a headline multiple that reads like a premium may be a base figure plus a contingent one somebody still has to go and earn. Our note on private equity, strategic and individual buyers covers how different buyers tend to structure it.
What a founder can actually move
Take the measurable part of the premium as tracking growth, evidence and scarcity more than classification, and the work follows from that.
- Can you evidence the growth, not just describe it? Cohort-level numbers beat a blended figure, and the metrics in the SaaS metrics that drive valuation and net revenue retention and valuation are where a buyer will look first.
- Is the AI genuinely load bearing, or is it a feature? Buyers who have run this process a few times can tell the difference quickly, and the diligence questions in what buyers look for in an acquisition get there fast.
- Does the capability survive without you? Capability buying is 95% of this market, and a capability concentrated in two people is a different proposition, which is the familiar shape of key person risk in a business sale.
- Are your unit economics measured? Inference and compute costs behave differently from traditional hosting, and figures like the LTV to CAC ratio buyers expect and churn benchmarks read differently when a cost line moves with usage.
- Which comparison set would you actually be priced against? Vertical and horizontal software price differently, as our note on vertical versus horizontal SaaS multiples sets out, and the same holds across cybersecurity and fintech.
Most of that list comes down to preparation, which is the argument running through our checklist for preparing a business for sale. In our experience the founders who land a strong outcome are seldom the ones who argued hardest about which category they belonged in.
Timing comes up often enough to be worth a note. Scarcity and performance age differently as sources of premium. Scarcity gets competed away once enough companies build similar capability, whereas a growth rate you can evidence across several quarters travels with the business wherever it goes. Build that evidence early, well before a process goes live. Our timeline for selling a business shows where the preparation sits relative to going to market.
A range, honestly stated, beats a number nobody can defend
Asking is there an AI premium on exit multiples turns out to be a better question than any of its available answers. Something is being repriced. The repricing runs unevenly across the stack, and most of what anyone can measure tracks growth and scarcity more closely than it tracks the classification. A founder who holds that picture is in better shape than one holding a number from a sample they have never seen.
For the wider picture, our AI M&A trends analysis covers where the activity is concentrated, what multiple does a SaaS business sell for gives the private benchmarks we publish, and the mid-year tech M&A report sets out current conditions. The process itself runs through our pillar on how to sell my SaaS business, the step-by-step guide for founders and the timeline for a sale.
FE International has completed more than 1,500 transactions since 2010 with a 94.1% success rate on private sales and acquisitions. If you want a view on where your own business would be priced and why, a business valuation works from your numbers rather than a category. Our notes on choosing an M&A advisor and the documents a buyer will ask for cover what comes next, and you can open a conversation about selling your business without committing to a process.
