
.jpg)
Vertical SaaS vs Horizontal SaaS Multiples: Which Sells for More?
Ask which category earns the better multiple and you will get a confident answer from almost anyone in software. Vertical, because switching costs are higher. Horizontal, because the market is bigger. Both answers are defensible, which is a reliable sign that the question is not quite the right one.
Our analysis of what multiple a SaaS business sells for sets out the ranges most private transactions clear and notes that vertical software with deep workflow integration has held up better than horizontal tools. It also gives an instruction this page picks up: benchmark against your sub-sector rather than against SaaS as a whole. What follows is how to do that, and why the category label is a weaker predictor than the two variables sitting underneath it.
One note on register. Nothing here says either category commands a higher price, because the published evidence does not support that claim at the level of an individual private transaction. What the evidence supports is a description of what buyers test, and that is what this page provides.
The short answer
Neither label reliably predicts a multiple. Vertical products tend to score well on how hard they are to remove and carry a specific risk on how much room is left in their market. Horizontal products tend to hold the mirror image of that trade-off. A buyer prices the two underlying variables, tests them with cohort data rather than with a category description, and arrives at a number that has more to do with your evidence than with your label.
The practical consequence is that the comparison most founders want to make, my category against the other one, is less useful than the comparison a buyer will make, which is your business against the other businesses they could buy inside your own sub-sector.
What the Labels Actually Describe
The distinction itself is simple enough. Vertical software is built for the workflows of one industry, such as software for dental practices, angling clubs or freight brokers. Horizontal software serves any business regardless of sector, which is what a general CRM, accounting package or project tool does.
The complication is that the label describes who the customer is, and buyers are pricing what the product does to that customer's operations. Those are correlated but not the same. A vertical product can sit on the edge of a workflow and be replaced over a weekend. A horizontal product can hold a system of record that a company builds a decade of process around. Our case study on selling a vertical SaaS business with embedded payments works through a transaction where the depth was real and the payments economics sat on top of it, which is the version of the vertical argument that holds up.
The Two Variables the Labels Stand In For

Reduce the comparison to what a buyer is underwriting and two variables do most of the work. The first is how hard the product is to remove, which determines whether the revenue base is likely to still be there in three years. The second is how much room is left in the market, which determines whether the business can keep growing without a step change in strategy.
Vertical software typically scores well on the first. Bessemer's review of a decade of vertical software investing describes the model as trading market size for market share, with market penetration above 50 percent achievable in a defined industry, and sets benchmarks of gross retention above 90 percent, net retention above 100 percent and gross margin above 80 percent for companies in the category. Those are the numbers a vertical business is implicitly claiming when it invokes its own defensibility.
Bessemer's list also points at where the second variable gets answered in practice. It describes vertical platforms adding revenue lines alongside the subscription, with some companies earning up to half their revenue from integrated payment processing, and cites indicative economics such as payroll at ten to twenty-five dollars per employee per month and card issuing take rates of one to three percent of spend. Those are not universal and they are not available to every business, but they show what an expansion path looks like when it is real rather than asserted.
The same trade-off creates the vertical risk. A market you can reach half of is a market you can run out of, and a buyer modelling five years of growth will notice. This is where horizontal businesses hold the advantage they are rarely given credit for: a general-purpose product in a large category may be easier to displace, but it is much harder to exhaust.
Variable One: Retention Is a Claim, Not a Category
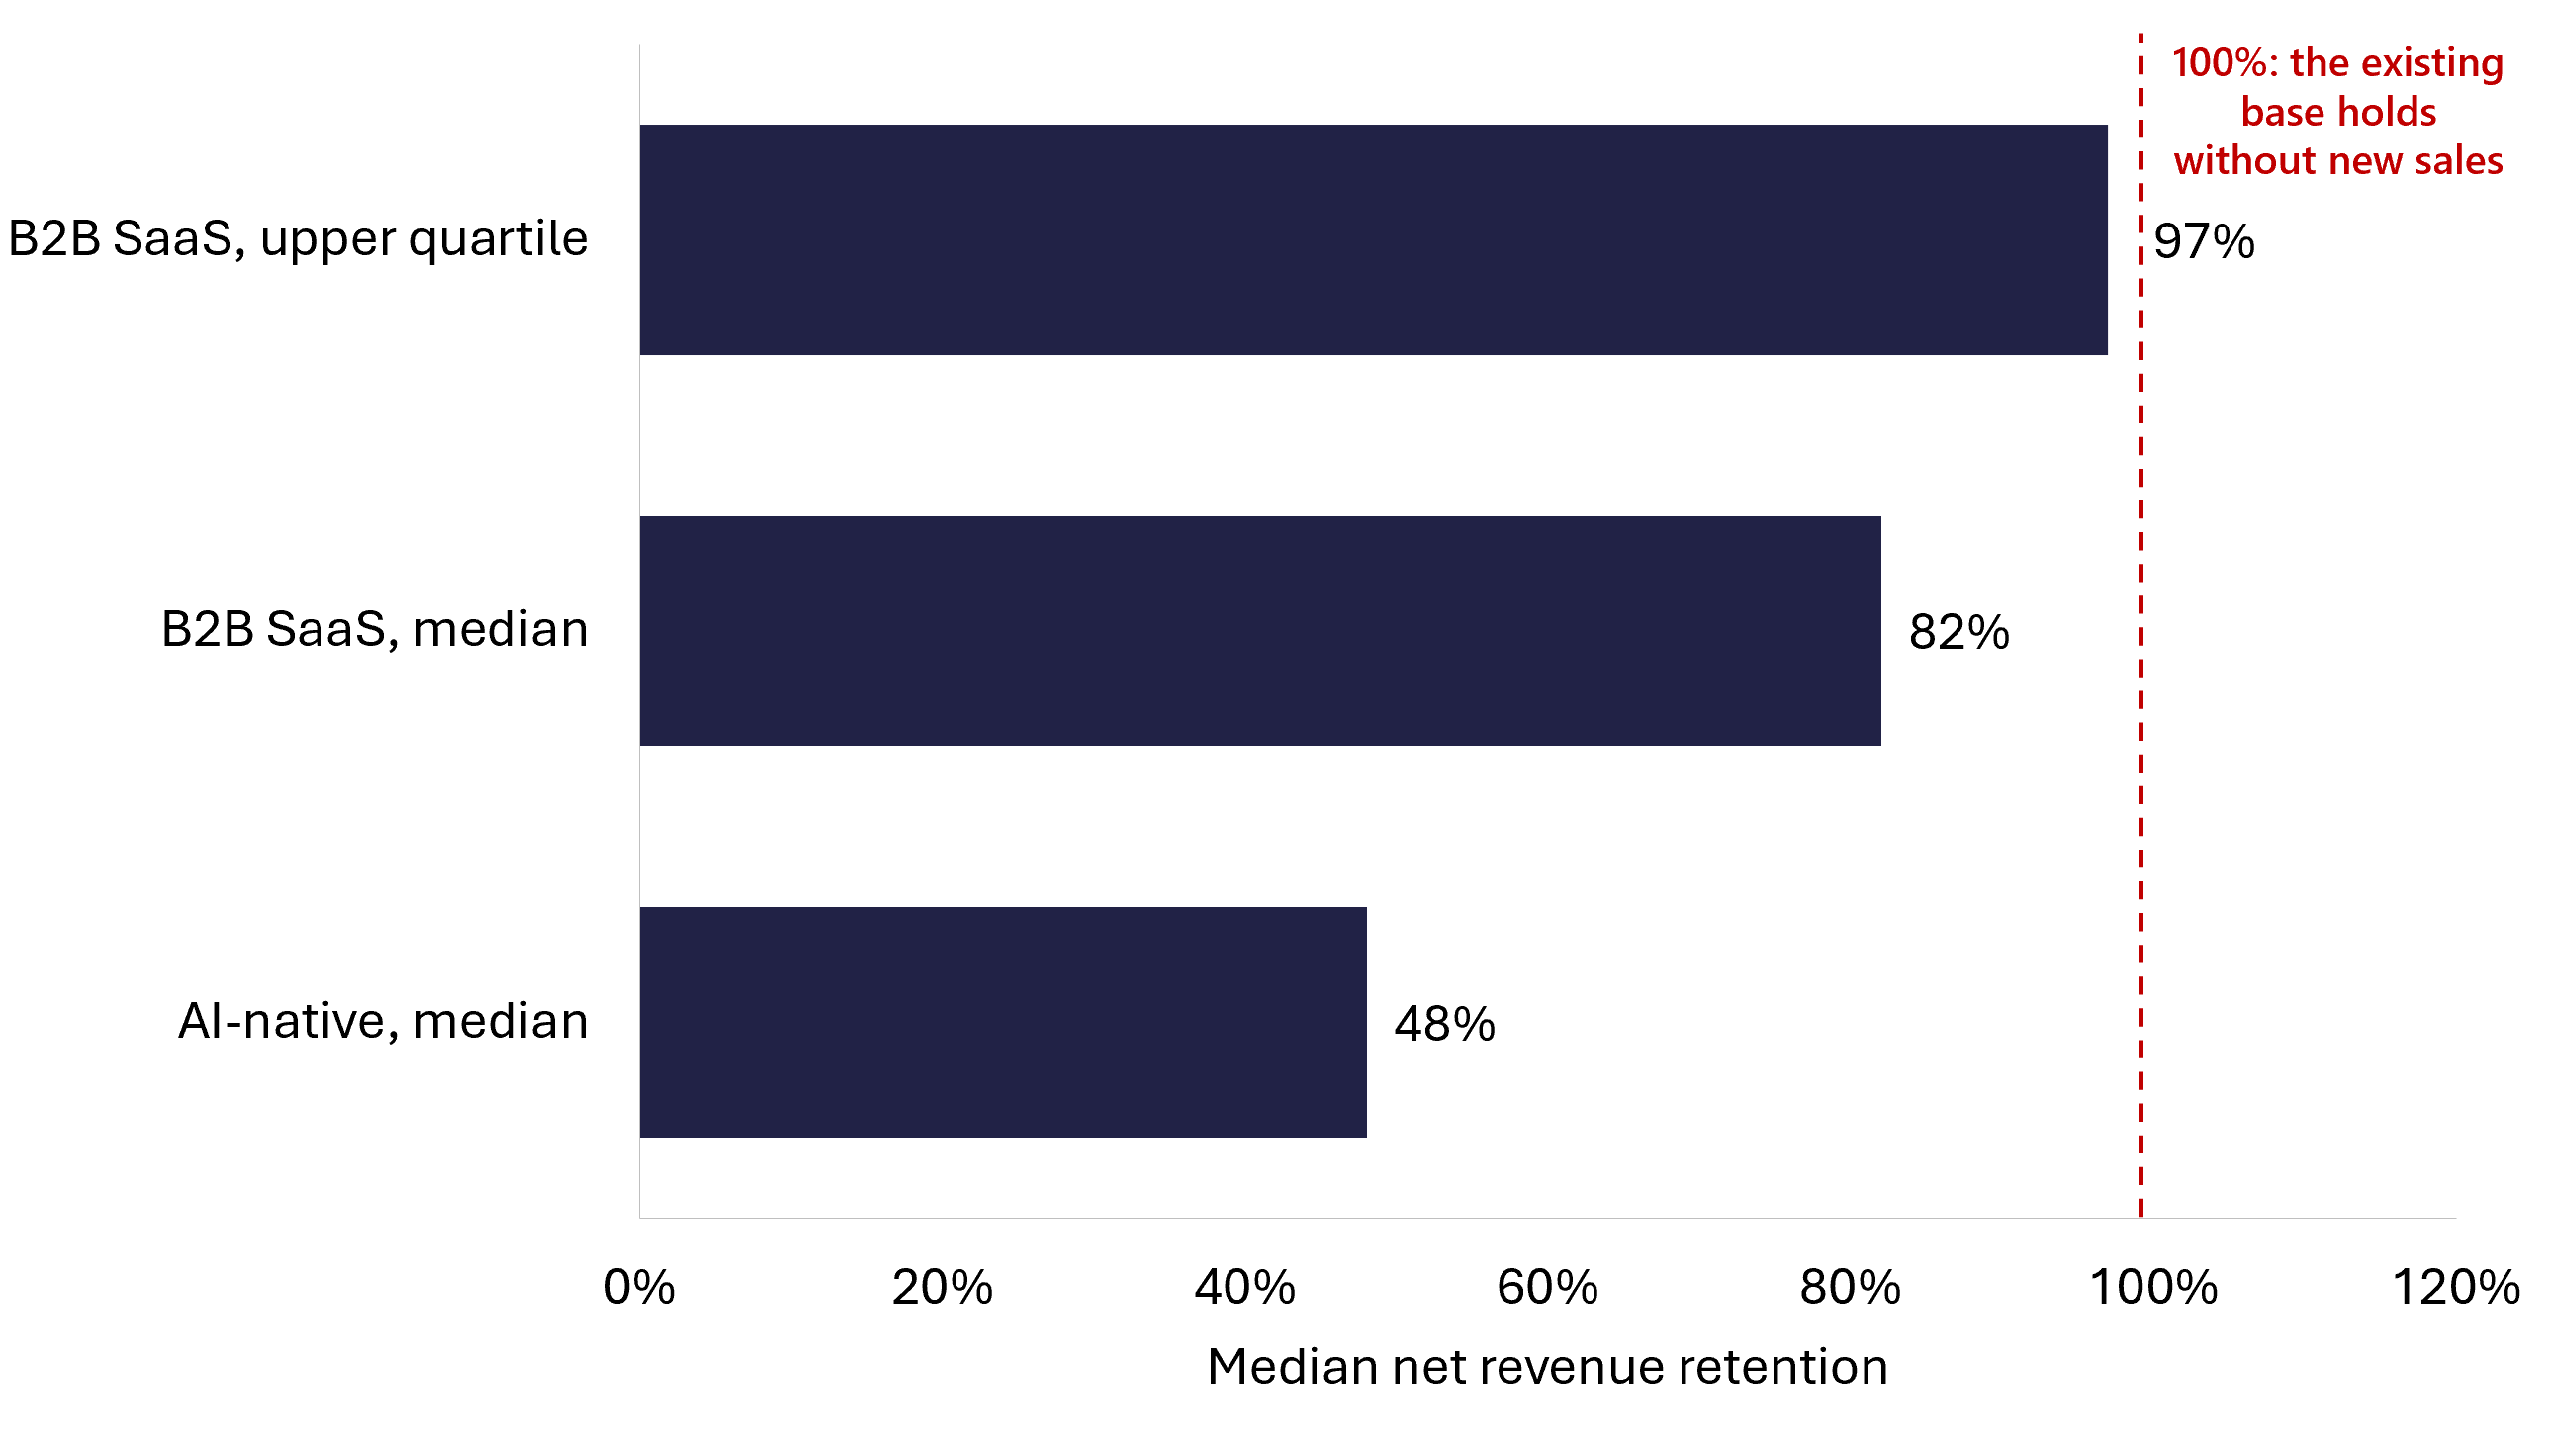
Here is the difficulty with asserting vertical stickiness in a sale process. ChartMogul's analysis of around 3,500 software companies above $250,000 ARR puts median B2B net revenue retention at 82 percent with the upper quartile near 97 percent on 2025 data. Both figures sit below the level at which an existing customer base holds its value without new sales.
So a vertical business claiming exceptional retention is not claiming to be slightly better than average. It is claiming a place in the top quartile of the whole market, and that is a testable proposition. Buyers test it with cohort retention by signup period, not with a description of the industry served. Our guides to net revenue retention and SaaS valuation and SaaS churn rate benchmarks set out what that evidence looks like when it is assembled properly.
There is a second reason evidence beats assertion here. Bain's software M&A work notes that almost half of technology deals in 2025 had some AI component, up from around a quarter the year before, and that acquirers are focused on differentiated intellectual property and proprietary data assets with appropriate workflows attached. Workflow depth has become the thing buyers underwrite explicitly rather than infer, which raises the standard of proof on both sides of the vertical and horizontal line.
Variable Two: How Much Room Is Left
Market size shows up in valuation less directly than founders expect. A buyer is not paying for the headline size of your market; they are paying for the growth runway it implies once your current position is taken into account.
This is where a well-run vertical business can find itself explaining rather than presenting. High penetration is evidence the product works and simultaneously evidence that the easy growth has happened. The credible answer is usually an expansion path rather than a larger market estimate: more product sold to the same customers, adjacent workflows absorbed, or a second revenue line added alongside the subscription.
Bessemer's more recent work on vertical AI argues the runway question is being reopened. It contends that AI lets software address work that was previously too manual or too small to serve profitably, unlocking markets once considered too niche for SaaS, and notes that business and professional services represent around 13 percent of US GDP against software's roughly 1 percent. The same analysis records LLM-native vertical companies running near 65 percent gross margins, below the software norm, which is the cost of doing work that used to be done by people. That trade, more addressable work at a lower margin, is a live question in valuation rather than a settled one, and our notes on how to value an AI business and the AI business valuation model in 2026 cover where the thinking currently sits.
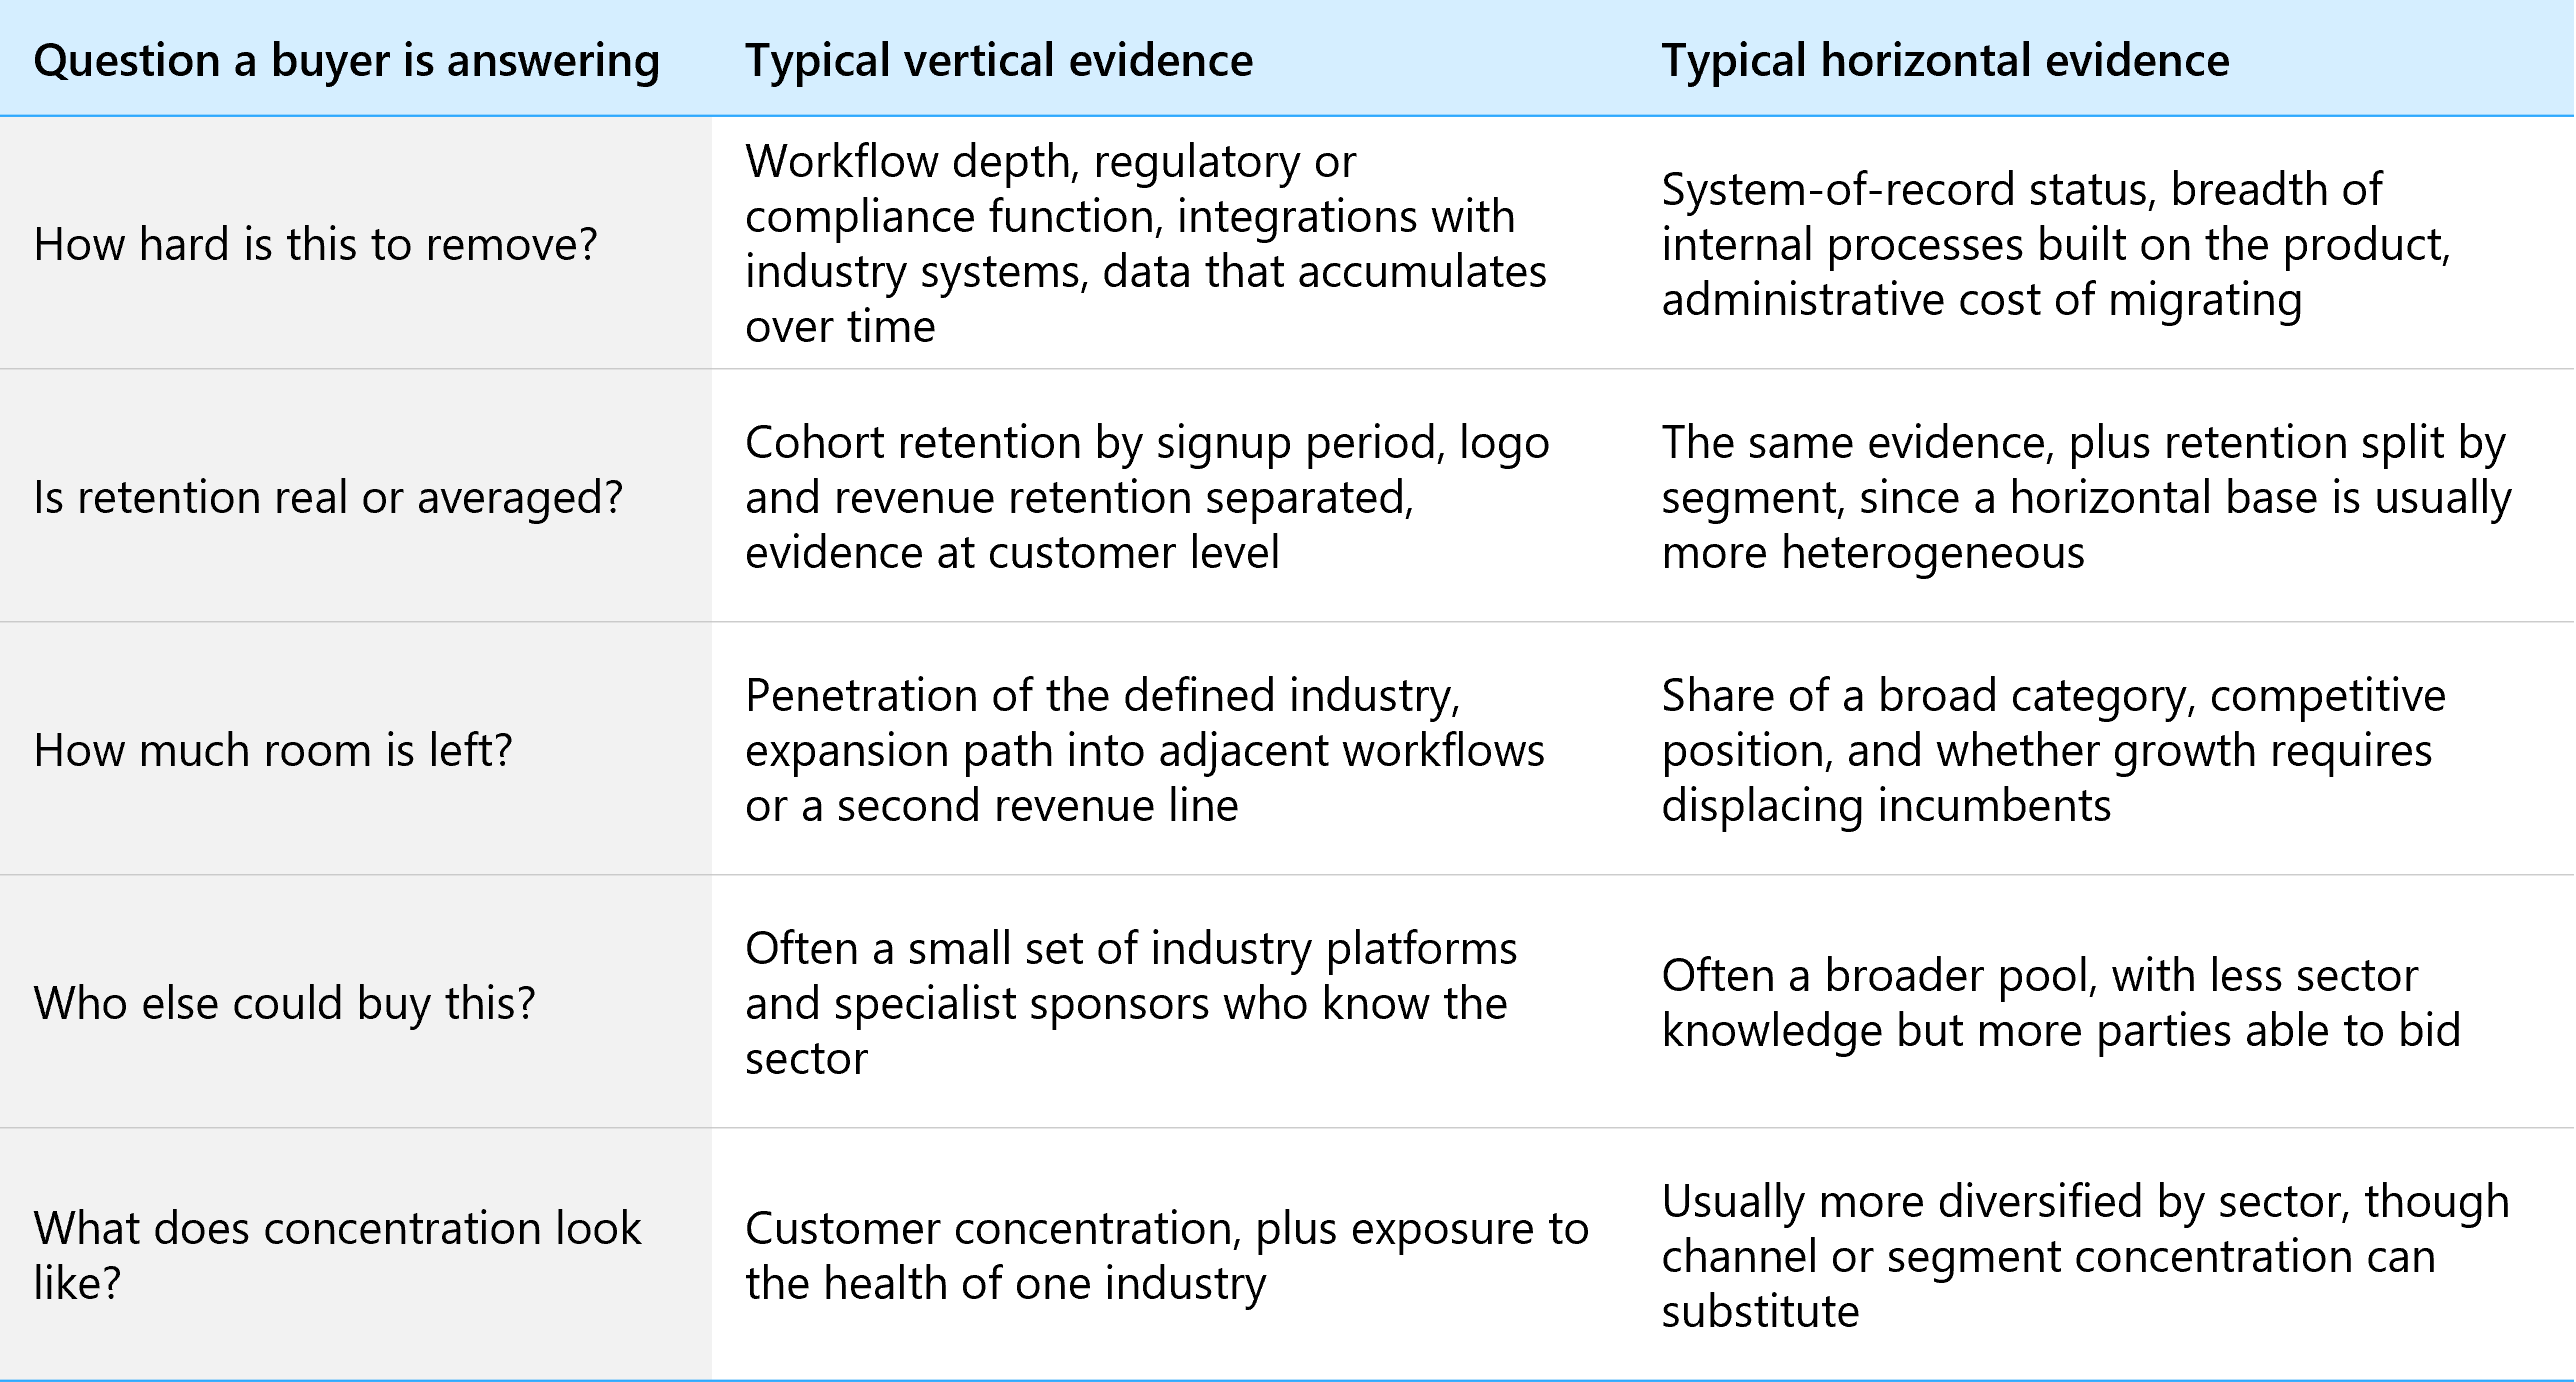
What a Buyer Tests on Each Side
The Buyer Pool Is Part of the Answer
One structural difference gets very little attention and can matter more than either variable above: how many credible buyers exist for your business, and what kind they are.
A deeply specialised vertical product is legible to a small number of acquirers who understand the industry, and largely illegible to everyone else. That can be an advantage, because a buyer who understands the workflow can underwrite it confidently and may pay for a capability they cannot build. It can also mean a thin field. Our comparison of private equity, strategic and individual buyers sets out how those parties differ, and the number of them at the table is one of the more reliable determinants of a final number.
The current market shape is worth knowing here. PitchBook reported that platform buyouts fell to around 41 percent of US software private equity deal value in 2026 to date, the lowest share in at least a decade, down from 71 percent at the end of 2025, while add-on acquisitions rose to roughly 45 percent of value. McKinsey's read of technology M&A similarly describes acquirers pursuing software products, intellectual property and specialised domain expertise through smaller, focused transactions.
For a vertical seller that cuts both ways and is worth thinking through rather than cheering. An add-on-heavy market means more buyers looking for exactly the specialised capability a vertical business has. It can also mean the natural acquirer is a single platform already operating in your niche, which is a different negotiation from a competitive process. Running a structured, confidential process matters more in a thin field than a crowded one, not less.
Where to Benchmark Instead
The pillar's instruction is to benchmark against your sub-sector rather than against SaaS as a whole, and that is the practical resolution of this comparison. Sub-sector reference points are closer to your business than any vertical-versus-horizontal average, because they capture the buyer pool, the regulatory posture and the growth dynamics at the same time.
Where FE International has published sub-sector work, that is the place to start: cybersecurity business valuation and the wider picture in 2026 cybersecurity M&A; how to value a fintech business alongside the fintech M&A outlook; edtech business valuation and edtech M&A; how to value an agency business; marketplace app valuation; and e-commerce valuation for businesses with a commerce component. The mid-year 2026 tech M&A report covers volume and pricing across those verticals together.
Read those against the general drivers rather than instead of them. The SaaS metrics that drive a valuation apply in every sub-sector, and the ranges in our analysis of SaaS valuation multiples by ARR band remain the frame that sub-sector detail adjusts.
What Moves Your Number Either Way
Strip out the category question and the work that changes an outcome looks much the same on both sides, which is itself informative.
Produce cohort retention rather than a blended average, because that is the evidence that converts a claim about stickiness into a fact. Separate software revenue from services cleanly, since the two are priced differently and a blended margin invites the question. Document the integrations, compliance work and workflow depth that make the product difficult to replace, which is the vertical argument stated as evidence rather than as positioning. Show an expansion path inside existing accounts, which answers the runway question directly. And reduce dependence on any single customer, channel or person, since those are the risks buyers price most consistently, as our note on what buyers look for in a SaaS acquisition in 2026 sets out.
It is worth being honest about the order of magnitude here. None of this work changes a category, and none of it is a substitute for the scale, growth and retention that set the band in the first place. What it tends to do is move a business within its range, which is where most of the recoverable value sits for a seller who is already inside a reasonable band. A business arguing for the top of its range on evidence is in a different conversation from one arguing for it on category membership, and the evidence takes months to assemble rather than weeks.
Most of that belongs in SaaS exit planning a year or more ahead rather than in the weeks before going to market, and it overlaps heavily with a SaaS due diligence process and with the documents needed to sell a SaaS company. The full sequence is set out in our guide to how to sell a SaaS business.
Where This Leaves You
The vertical SaaS vs horizontal SaaS question is a useful way into a valuation conversation and a poor way to finish one. Both labels describe who you sell to. Buyers are pricing what you do to the customer once they have bought, and how much of that work is still available to win. Those are the things worth evidencing, and they are visible in cohort data long before they are visible in a category description.
If you want to see how your business reads against its own sub-sector rather than against a market-wide average, you can request a confidential valuation, or read how FE International sells SaaS businesses. For the question underneath all of this, our note on how much a business is worth is the place to go next.
