

FinTech Valuation Multiples in 2026: Payments, Lending, and Infrastructure Benchmarks

Fintech valuation multiples in 2026 range from roughly 1x to 3x net revenue for balance-sheet lenders and volume-only processors to 5x to 10x or more for software-led payments and infrastructure businesses, with EBITDA multiples mostly between 7x and 15x. Segment, revenue quality, regulatory posture and interchange exposure decide where a business lands inside those ranges.
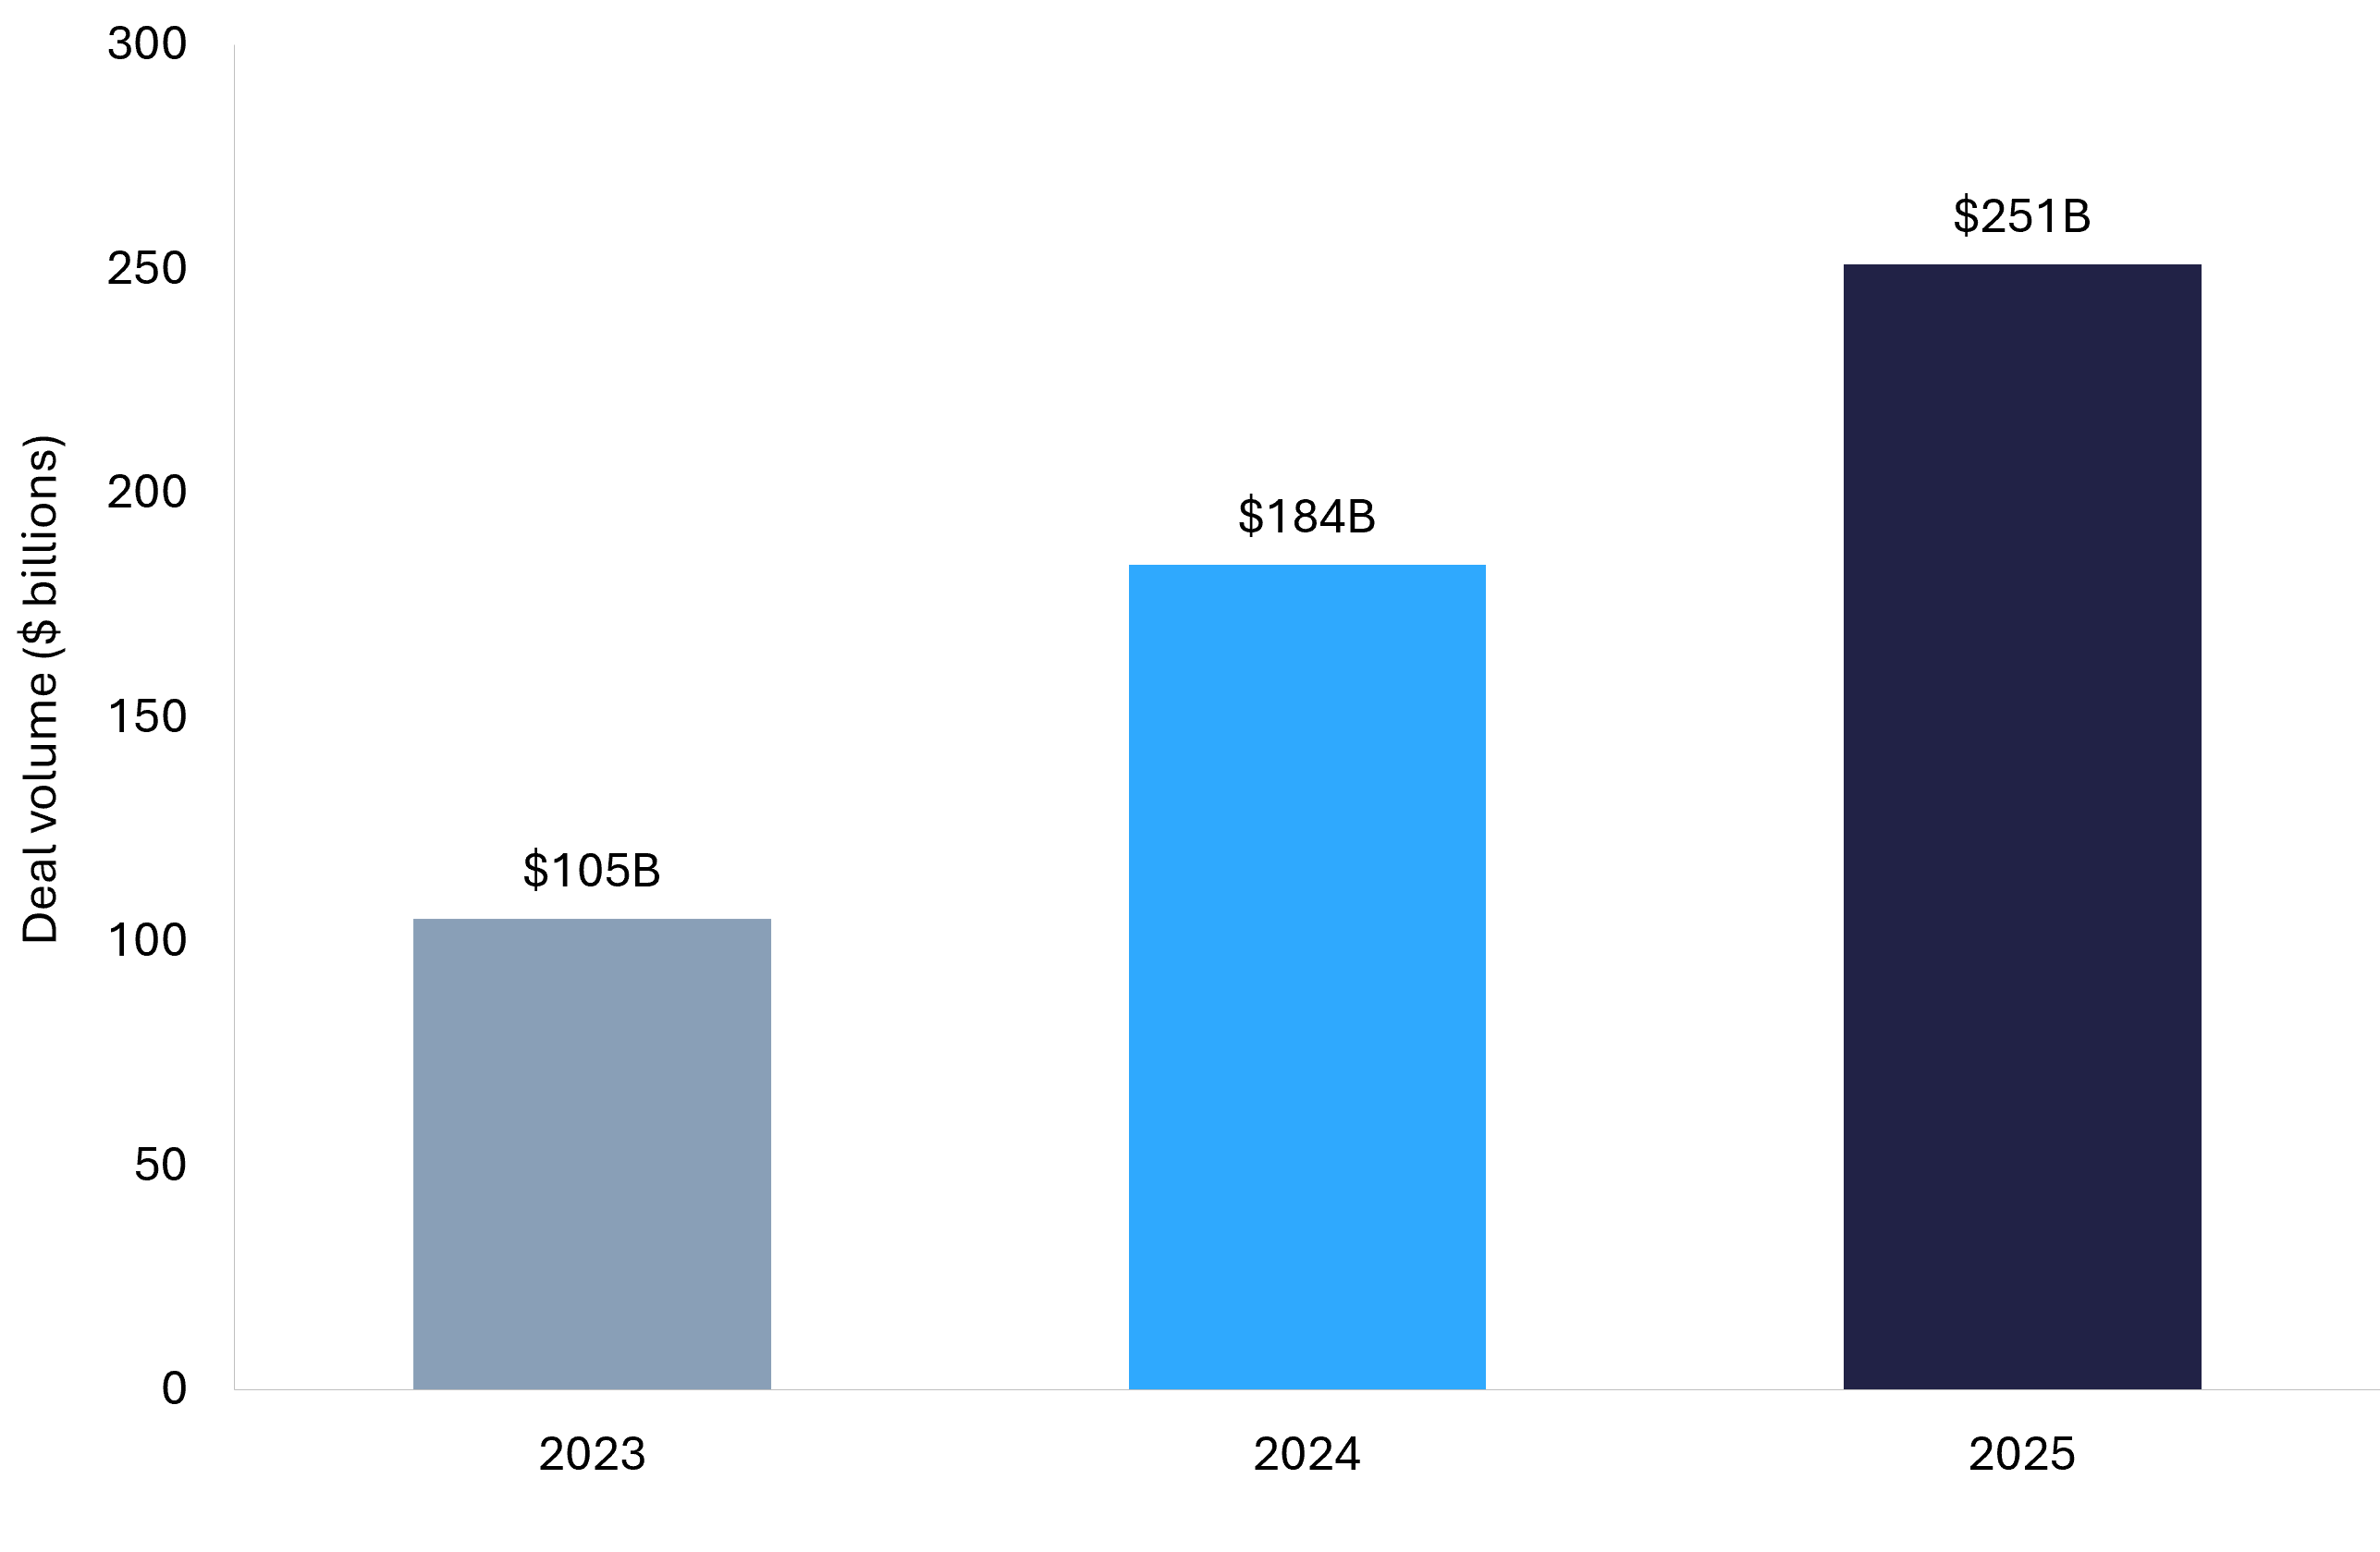
Fintech M&A volume reached $251 billion in 2025, up from $184 billion in 2024 and $105 billion in 2023, and the first half of 2026 added $103.1 billion of fintech investment across venture capital, private equity and M&A, putting the market on track for a four-year high. Buyers are writing larger cheques for fewer businesses: the global median fintech M&A deal size climbed to $80.9 million in 2026 to date, from $44.0 million across 2025. That is the backdrop every owner should start from, and it is a good one.
But fintech is not one market. A merchant processor earning basis points on volume, a consumer lender carrying credit risk and an API business billing per call are priced on different metrics, by different buyers, and land at very different fintech valuation multiples. This guide, the fifth in our multiples series after SaaS valuation multiples, sets out 2026 revenue and EBITDA benchmarks for payments, lending and infrastructure, explains how regulatory posture, unit economics and interchange exposure move the number, and shows how the gap between private and public pricing works in practice. For the underlying methods, our guide on how to value a fintech business covers the SDE, EBITDA and revenue approaches in detail, and our fintech M&A outlook covers the buyer side. Here the focus is on what buyers are paying, why, and what an owner can do about it before going to market.
What Are Fintech Valuation Multiples in 2026, and How Are They Calculated?
A valuation multiple is shorthand: enterprise value divided by a financial metric, and the question of how to value a fintech company starts with picking the right metric. Three do most of the work in fintech. EV to net revenue applies to growth businesses and to anything with a software-like revenue line. EV to EBITDA applies once a company has a management team and real profit. A multiple of seller's discretionary earnings (SDE) applies to smaller owner-operated businesses, typically under a few million dollars of earnings, where the owner's salary and perks are added back to show the cash flow a buyer actually receives.
The word that matters most in that list is net. Payments businesses in particular report gross volume, gross revenue and net revenue, and only the last one gets a multiple. Take an illustrative vertical payments platform processing $400 million a year at a 1.2% blended rate. It books $4.8 million of gross revenue, but roughly $3.2 million of that is interchange and network fees passed straight through to issuers and card schemes. Buyers price the $1.6 million of net revenue. At 6x net revenue the business is worth about $9.6 million; the same 6x applied carelessly to gross revenue would imply $28.8 million. The first job in any fintech sale process is agreeing what revenue means.
Where does the market sit? Across all industries, the median M&A multiple held at 10.2x trailing EBITDA in the second quarter of 2026, and fintech sits around that midpoint with an unusually wide spread. In public markets, profitable fintechs kept a valuation premium through the third quarter of 2026 while loss-making peers saw further multiple compression. Year-end 2025 cohort medians give the reference points: 7.7x trailing EBITDA for medium-growth payments companies, 8.5x for medium-growth fintech, and 19.8x for neobanks and neobrokers, with most cohorts trading below those levels during 2026. For a private seller, those numbers are the floor buyers anchor to before adding a premium for control, synergies and scarcity.
Why do fintechs earn software-style multiples when banks trade on book value? Growth and margin. Global fintech revenue grew 22% in 2025 to $504 billion, more than four times faster than incumbent financial institutions, and 74% of the largest public fintechs are now profitable, with average EBITDA margins up 400 basis points to 20%. Banks are priced on price-to-book and earnings because their growth is constrained by capital; fintechs are priced on revenue and EBITDA because they are asset-light and compounding. The trend since the 2021 peak is also clear: the sector's rebound rests on operating performance rather than cheap capital, which is exactly why today's multiples are more durable than the ones seen at the top of the last cycle.
In 2026, fintech valuation multiples are earned on net revenue, profit and regulatory readiness, not on growth alone.
Fintech Valuation Multiples by Segment: Payments, Lending and Infrastructure
The table below shows the ranges we see buyers underwrite in 2026. They are FE International advisory ranges, calibrated to disclosed 2025 and 2026 transactions, public cohort data and our own deal flow, and they should be read as starting points. A business at the top of its segment on revenue quality routinely clears the next segment's range; a business with concentration or compliance gaps lands below its own.
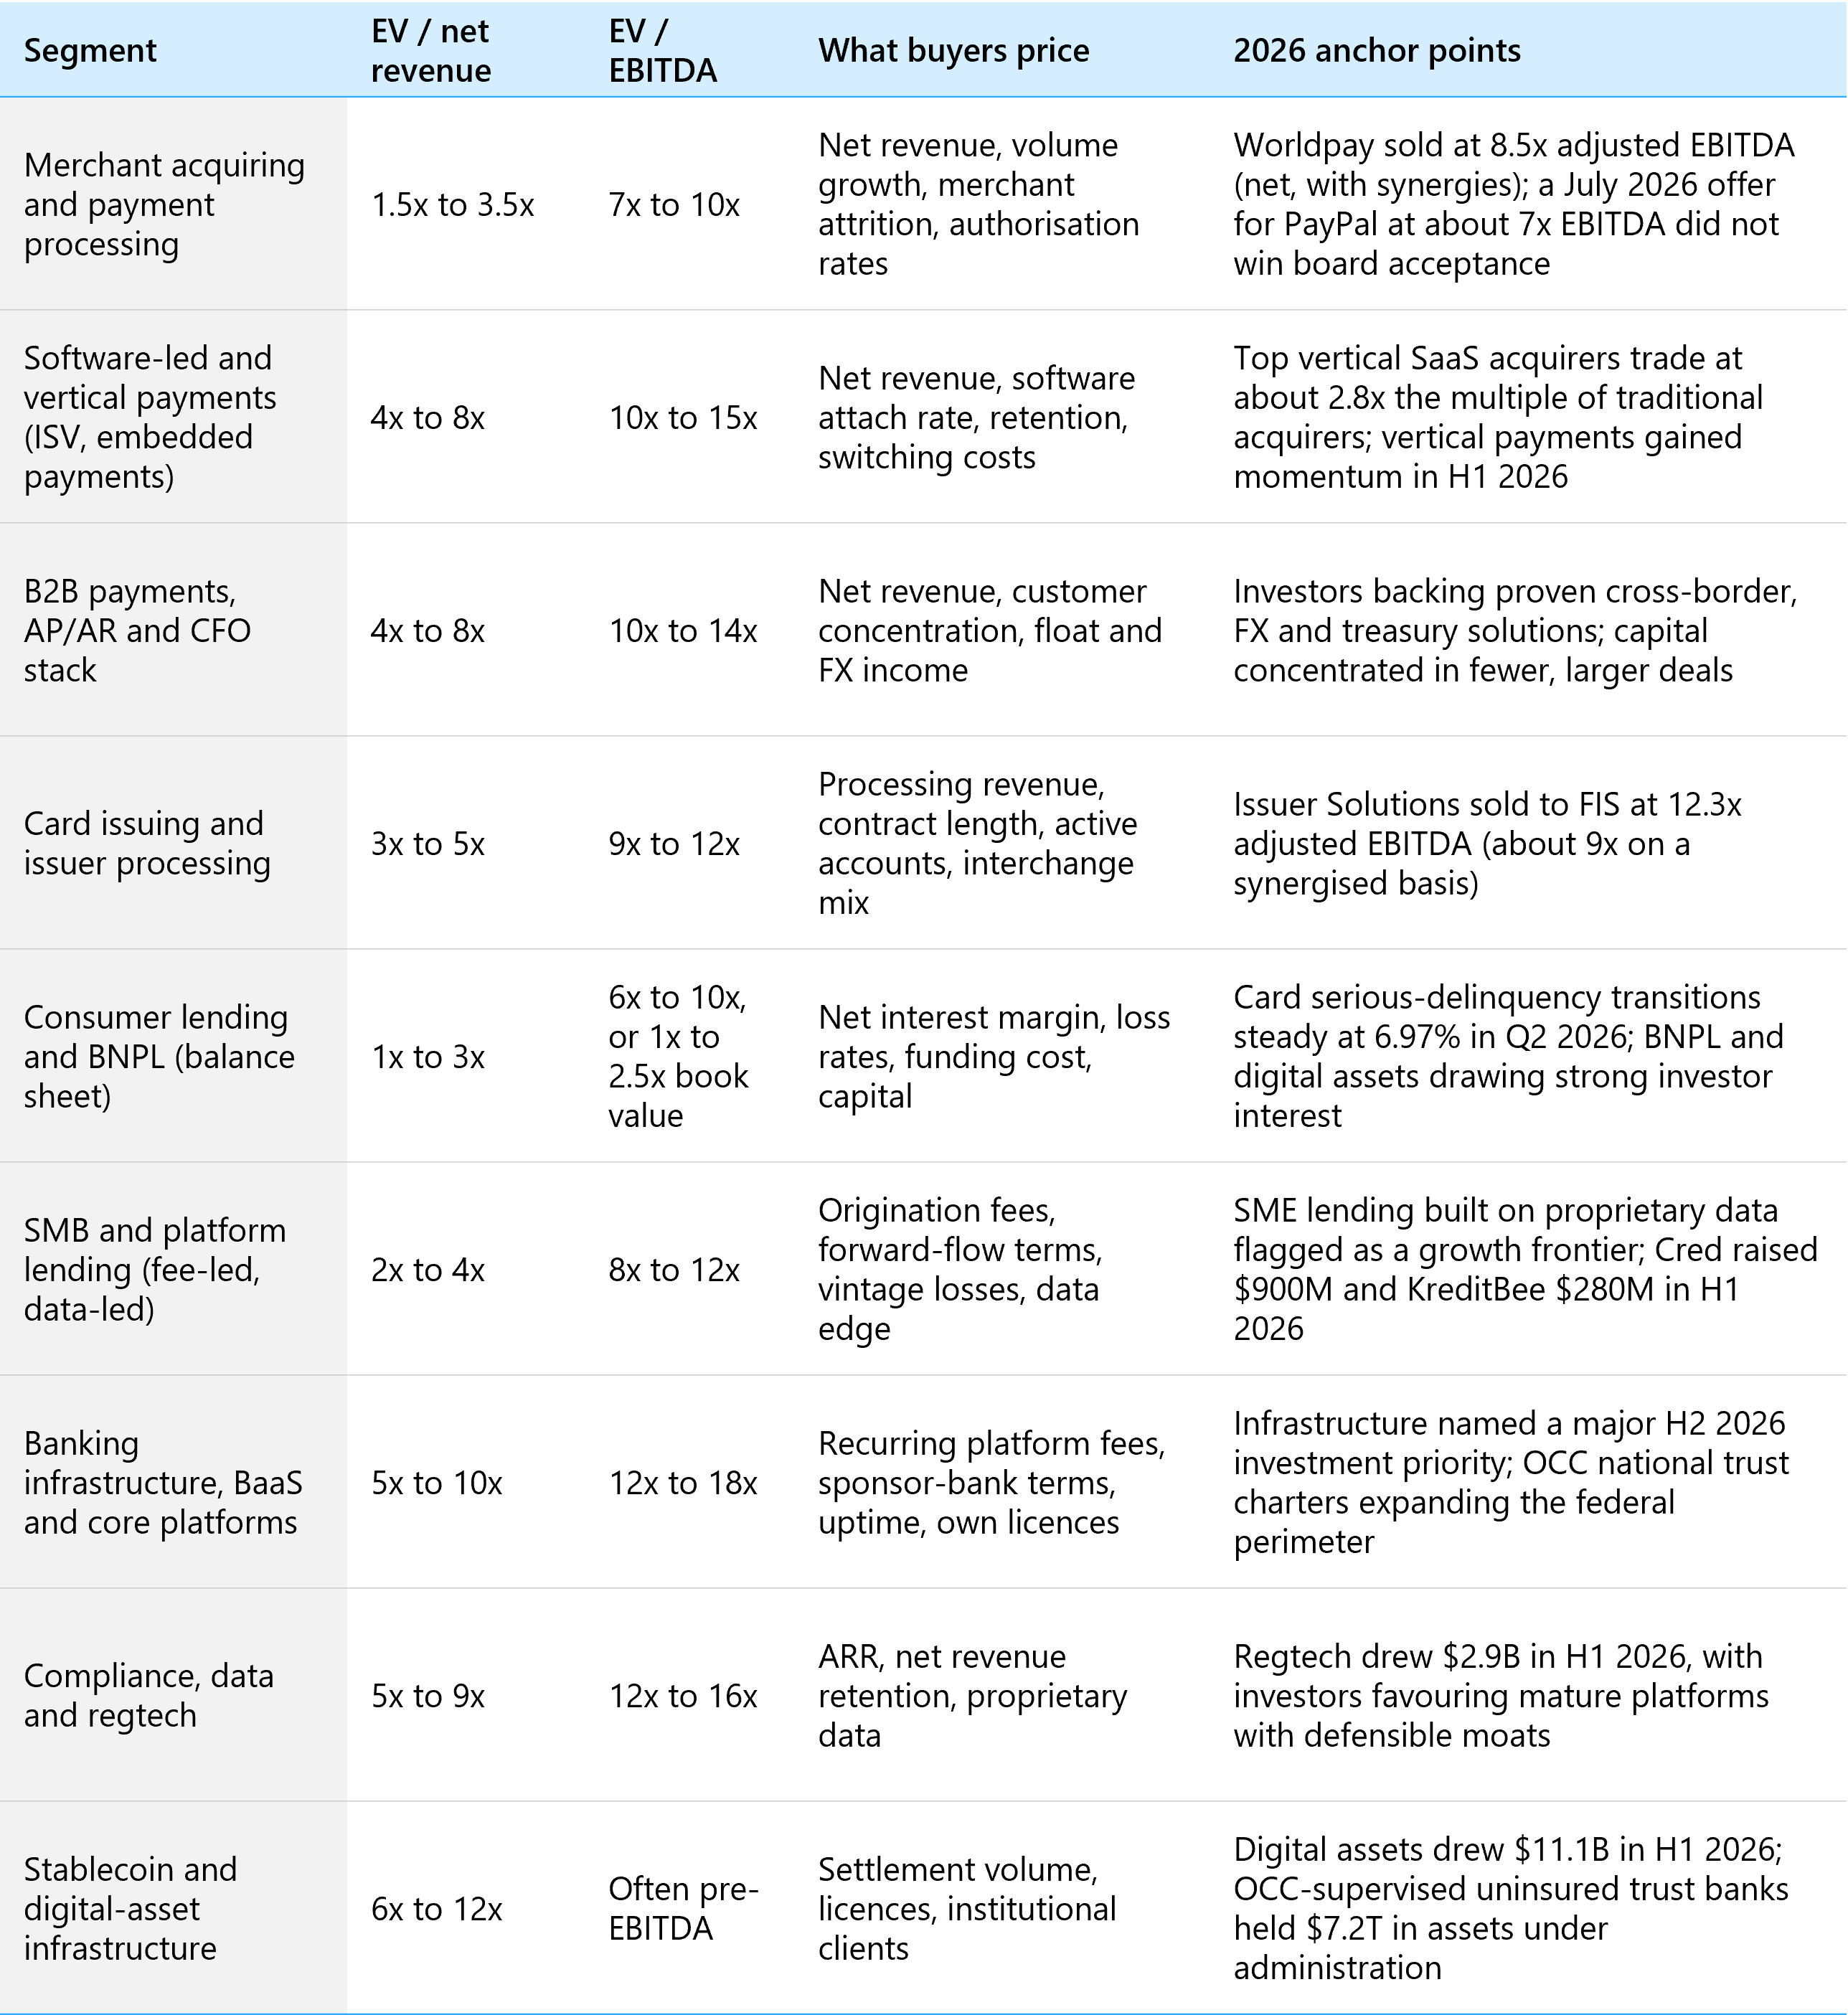
Two patterns run through the table. The premium belongs to revenue that behaves like software: recurring, high gross margin after processing costs, and attached to a workflow the customer cannot easily leave. The discount belongs to revenue that behaves like a bank: credit risk, funding cost and capital tied up on the balance sheet. Segment labels matter less than which of those two your revenue resembles, which is also why fintech revenue multiples compared with tech startups look so similar at the top of the table and so different at the bottom.
The segments with the highest fintech valuation multiples in 2026 are the ones closest to pure software and furthest from the balance sheet: compliance and data platforms, banking infrastructure, and software-led payments. AI-native infrastructure sits at the top of that group. The third quarter of 2026 was a selective environment favouring AI-native bets, with Stripe's $8 billion acquisition of OpenRouter signalling that large incumbents will buy AI-native infrastructure rather than build it, and AI-related fintech deals attracted $21.4 billion across 800 deals in the first half of 2026 alone.
Buyers pay software multiples for software economics and bank multiples for bank economics. The label on the company matters less than which one its revenue resembles.
Why Do Payments Companies Get Such Different Multiples?
Payments is the largest fintech vertical and still the largest revenue pool in banking. Global payments generated about $2.6 trillion in revenue from 3.8 trillion transactions in 2025, roughly 41% of total banking revenues, and the pool is projected to reach $3.2 trillion by 2030. Growth is moderating toward about 4% a year, which is precisely why investors have become choosy. When the tide stops lifting every boat, they pay for the companies gaining share.

The public market shows what choosy looks like. Many payments companies trade roughly 25% below their 10-year average valuations, investors now discount growth driven mainly by processing volume while paying for revenue backed by deeper engagement and higher switching costs, and the top vertical SaaS-based acquirers trade at roughly 2.8 times the valuation multiple of traditional acquirers and processors. Closing the sector's valuation gap would add an estimated $500 billion in market capitalisation, which is a large re-rating opportunity for businesses that can prove durable revenue quality, and a clear benchmark for sellers pricing against public comps.
Deal evidence from 2026 lines up with that split. Global Payments completed its acquisition of Worldpay in January 2026 at a $24.25 billion total value, 8.5x adjusted EBITDA on a net basis including run-rate synergies, while selling its Issuer Solutions business to FIS at 12.3x adjusted EBITDA. FIS described the same issuer business at about 9x synergised EBITDA, and sold its 45% Worldpay stake at roughly 10.5x expected 2025 EBITDA, a premium to the 9.8x it achieved on the 55% stake in 2024. In July, a Stripe-Advent consortium offered $60.50 a share, about $53 billion, for PayPal, which works out at around 7x EBITDA against an 8x to 12x median for payments businesses; PayPal's board did not accept it, and the consortium stepped back in late August. The lesson for a payments company valuation is simple: scaled processing clears 7x to 9x EBITDA, issuer processing and software-attached revenue clears 10x to 12x and above, and boards with durable franchises hold out for it.
The dividing line is take-rate durability and software attach. As checkouts dissolve into software, the value in a transaction moves to the control layer: identity, consent, routing and policy, which is where the recurring fees now sit. Capital is following that logic. The payments space attracted $44.2 billion of investment in the first half of 2026, more than double the full-year 2025 figure, across just 168 deals, with investors favouring scaled, profitable and infrastructure-focused businesses and vertical payments gaining momentum in healthcare, restaurants, fitness and travel. We saw the same demand first-hand when we advised on the sale of a vertical SaaS and embedded payments platform in 2026: buyers moved fast for a workflow tool that monetises the payments inside it.
For a seller, this translates into five numbers to lead with: net revenue, software attach rate, merchant or customer attrition, gross margin after processing costs, and the share of volume on regulated versus exempt rails. Present those well and the multiple conversation starts in the upper half of the range.
A payments company valuation starts with net revenue and ends with how much of that revenue is software.
How Does Interchange Exposure Move the Number?
Interchange exposure is one of the fastest ways to move fintech valuation multiples in either direction. Interchange is the fee an acquirer pays the card issuer on every card transaction. It is pass-through for most processors, a cost for merchants and revenue for issuers, which includes most neobanks, prepaid programmes and the card products inside banking-as-a-service platforms. Buyers in 2026 map exactly where a target sits in that chain before they talk price, because the rules are moving.
In the United States, Regulation II caps interchange on regulated debit transactions at 21 cents plus 0.05% of the transaction, with a further 1 cent for issuers meeting fraud-prevention standards, for issuers with $10 billion or more in assets. The Federal Reserve's 2023 proposal to cut the base component to 14.4 cents is still pending, and on October 26, 2026 the Eighth Circuit struck down the current cap and sent the Fed back to rewrite the rule. Smaller issuers are exempt, which is the structural reason most fintech card programmes run through sponsor banks under the $10 billion line: the exemption is worth real money, and buyers now stress-test what happens if the regulated rate falls, if the exemption changes, or if the sponsor bank grows past the threshold.
Credit interchange is in play too. The Credit Card Competition Act of 2026 was introduced in the Senate on January 13, 2026 and referred to committee; it would require the largest issuers to enable a second, unaffiliated network on their credit cards. The longer-run shift comes from software rather than Congress: agentic optimisation could reroute roughly 30% of the $10.3 billion US net card interchange pool by 2030 as AI agents route transactions away from high-fee rails. Issuers in Brazil and Australia already operate under tighter rules, and investors are weighing the possibility of expanded caps in the EU and lower debit interchange rates in the US.
How does that change a valuation? Buyers run an interchange sensitivity on every target with issuing or card revenue. In our experience, the questions below decide whether interchange-linked revenue gets priced like recurring software or like a regulated utility:
- What share of net revenue comes from interchange, split by regulated debit, exempt debit and credit?
- How much of that revenue would survive a cut in the regulated rate, or a change to the small-issuer exemption?
- Is the sponsor bank below $10 billion in assets today, and what does the contract say if it crosses the line?
- Does the business earn subscription, interest, float or software revenue alongside interchange?
- Can the platform route across networks and rails to optimise cost, or is it locked to one?
The pattern is consistent: diversified fee mixes and routing capability earn a premium, and businesses that built their economics on one regulated rate earn a discount until the rule settles. The upside of the current moment is clarity. Once the Fed publishes a rewritten standard, the overhang on interchange-funded fintechs lifts, and companies that have already diversified will re-rate first.
Every point of net revenue that depends on a regulated interchange rate is discounted in 2026; every point that comes from software, subscriptions or float earns a premium.
How Are Lending Fintechs Valued in 2026?
Lending fintechs carry the lowest fintech valuation multiples on a revenue basis, and for a logical reason: their revenue comes with credit losses, funding costs and capital requirements attached. Buyers value balance-sheet lenders the way they value banks, on price-to-book, net interest margin and risk-adjusted return on equity, and then test the loan book vintage by vintage. Platforms that originate and sell, or that earn servicing and origination fees on other people's capital, are priced closer to software because their revenue does not sit on a balance sheet.
The credit backdrop in 2026 is steady, which is the base case buyers underwrite from. In the second quarter, 4.7% of US household debt was in some stage of delinquency, down slightly on the quarter, and the flow of credit card balances into serious delinquency was essentially flat year over year at 6.97%. Stable transition rates mean a lender's own loss curves, not the macro cycle, decide the multiple.
Demand is there. SME lending built on proprietary data is one of six areas where the next wave of fintech expansion is likely to concentrate, in a sector that generated about $650 billion of revenue in 2025 with payments the largest vertical at around $250 billion. Investors funded it through the first half: Cred raised $900 million and KreditBee $280 million in Asia-Pacific, while Canada's digital mortgage lender Nesto raised $218.6 million and joined the period's new unicorns.
Interest rates cut both ways for lending fintechs. Higher rates raise funding costs and test how much a lender can pass through to borrowers; they also lift income on float, deposits and reserves for any platform that holds balances. Buyers price the net of the two, which is why a lender with committed, diversified funding and a demonstrated ability to reprice earns a higher multiple than one reliant on a single warehouse line, whatever the rate environment does next.
What moves a lending multiple up: loss rates inside underwriting targets through 2026, diversified and committed funding (forward-flow agreements, warehouse lines, deposits where the licence allows), a documented data advantage in underwriting, automated servicing, and clean state and federal licensing. What moves it down: losses rising faster than the book, single-source funding, and manual processes that do not scale.
Lending fintechs earn higher multiples by making revenue look less like a loan book and more like a platform: fees, data and distribution.
What Do Infrastructure and Embedded Finance Businesses Trade For?
Infrastructure is where fintech revenue looks most like software, and it carries the highest fintech valuation multiples in the segment table as a result. The category covers banking-as-a-service, core and ledger platforms, payments orchestration, identity and KYC, and stablecoin and settlement rails. Monetisation is per account, per API call, per mandate or per seat, with transaction fees as a second layer. That is the revenue profile buyers pay 5x to 10x net revenue for, because it recurs, it carries high gross margin, and the customer has to re-platform to leave.
Demand in 2026 is broad. Digital assets attracted $11.1 billion of investment in the first half of 2026, with banks and financial services firms investing in the infrastructure needed to support adoption as clearer regulatory frameworks and growing institutional participation moved the sector into the mainstream. The same shift is visible in core systems, where traditional institutions are replacing ageing platforms to compete and to protect data, and in stablecoin and settlement rails scaling across regions. Regulatory frameworks such as the GENIUS Act in the US and MiCA in the EU have moved that activity from speculative to institutional, and the regulatory perimeter itself is becoming a priced asset.
That perimeter widened fast this year. The Office of the Comptroller of the Currency conditionally approved three national trust bank charters on a single day, September 18, 2026, following approvals for Bridge in February and Coinbase in April, and OCC-supervised uninsured national trust banks reported $7.2 trillion in assets under administration as of March 31, 2026. For an infrastructure business, a charter or licence in its own name changes the diligence conversation: it removes the question of what happens if a partner bank exits, and it supports a premium.
Embedded finance is the distribution side of the same story. Software platforms that embed payments, cards, lending or insurance inside a vertical workflow convert their customers' money movement into recurring revenue, which is why they price with software rather than with payments. The risks buyers price are specific: sponsor-bank concentration, uptime and resilience, compliance liabilities inherited from partners, and whether the platform owns the customer relationship or rents it. A business with multiple bank partners, its own licences, documented controls and contractual protection on pricing clears the top of the range; a business built on one partner contract gets a discount tied to that contract's term.
Infrastructure earns the top of the fintech multiple range when its revenue is recurring, its licences are its own, and its customers would have to re-platform to leave.
How Does Regulatory Posture Change a Fintech Valuation?
Regulatory posture used to be a diligence item. In 2026 it is a valuation input. The regulatory gap between banks and fintechs is narrowing in the US, UK and EU, charter and licensing pathways are becoming more accessible, major fintechs applied for US federal bank charters in growing numbers over the past year, and scaled fintechs out-acquired incumbents in 2025 with 659 deals against 589. M&A has become a primary tool for building capability in AI, digital assets and compliance, and buyers with that agenda pay for regulatory readiness because it shortens their own path.
We find it useful to sort targets into three postures. Licensed in its own name (money transmitter licences, an EMI licence, a trust or bank charter): buyers price this at a premium and diligence moves faster. Partner-dependent (sponsor bank, BIN sponsor, agent-of-record arrangements): priced at a discount tied to contract terms, concentration and the partner's own regulatory standing. Unlicensed or grey: either the largest discount or no deal, because the acquirer inherits the remediation.
Compliance capability is also becoming a moat in its own right. Regtech attracted $2.9 billion of investment in the first half of 2026, led by AI-powered AML and KYC risk intelligence and compliance platforms, with investors narrowing their interest to mature platforms with proven technology, defensible moats and proprietary data relationships. A well-automated compliance function now shows up in the margin as well as in the risk assessment, and buyers test both.
Governance belongs in the same conversation. Audited financials, board-level risk oversight, documented consumer-outcome metrics and a clean complaints history are the governance evidence buyers ask for first, and they are the difference between a process that closes in weeks and one that stalls in confirmatory diligence.
In 2026, a licence is a valuation asset and a sponsor-bank dependency is a diligence item. Buyers price both.
Which Unit Economics Set a Fintech's Multiple?
Multiples are outcomes. Behind every number in the segment table sits a handful of operating ratios, and buyers in 2026 are unusually consistent about which ones they test. The table below sets out the value drivers we see move fintech valuation multiples most, what pushes them up and what pulls them down.
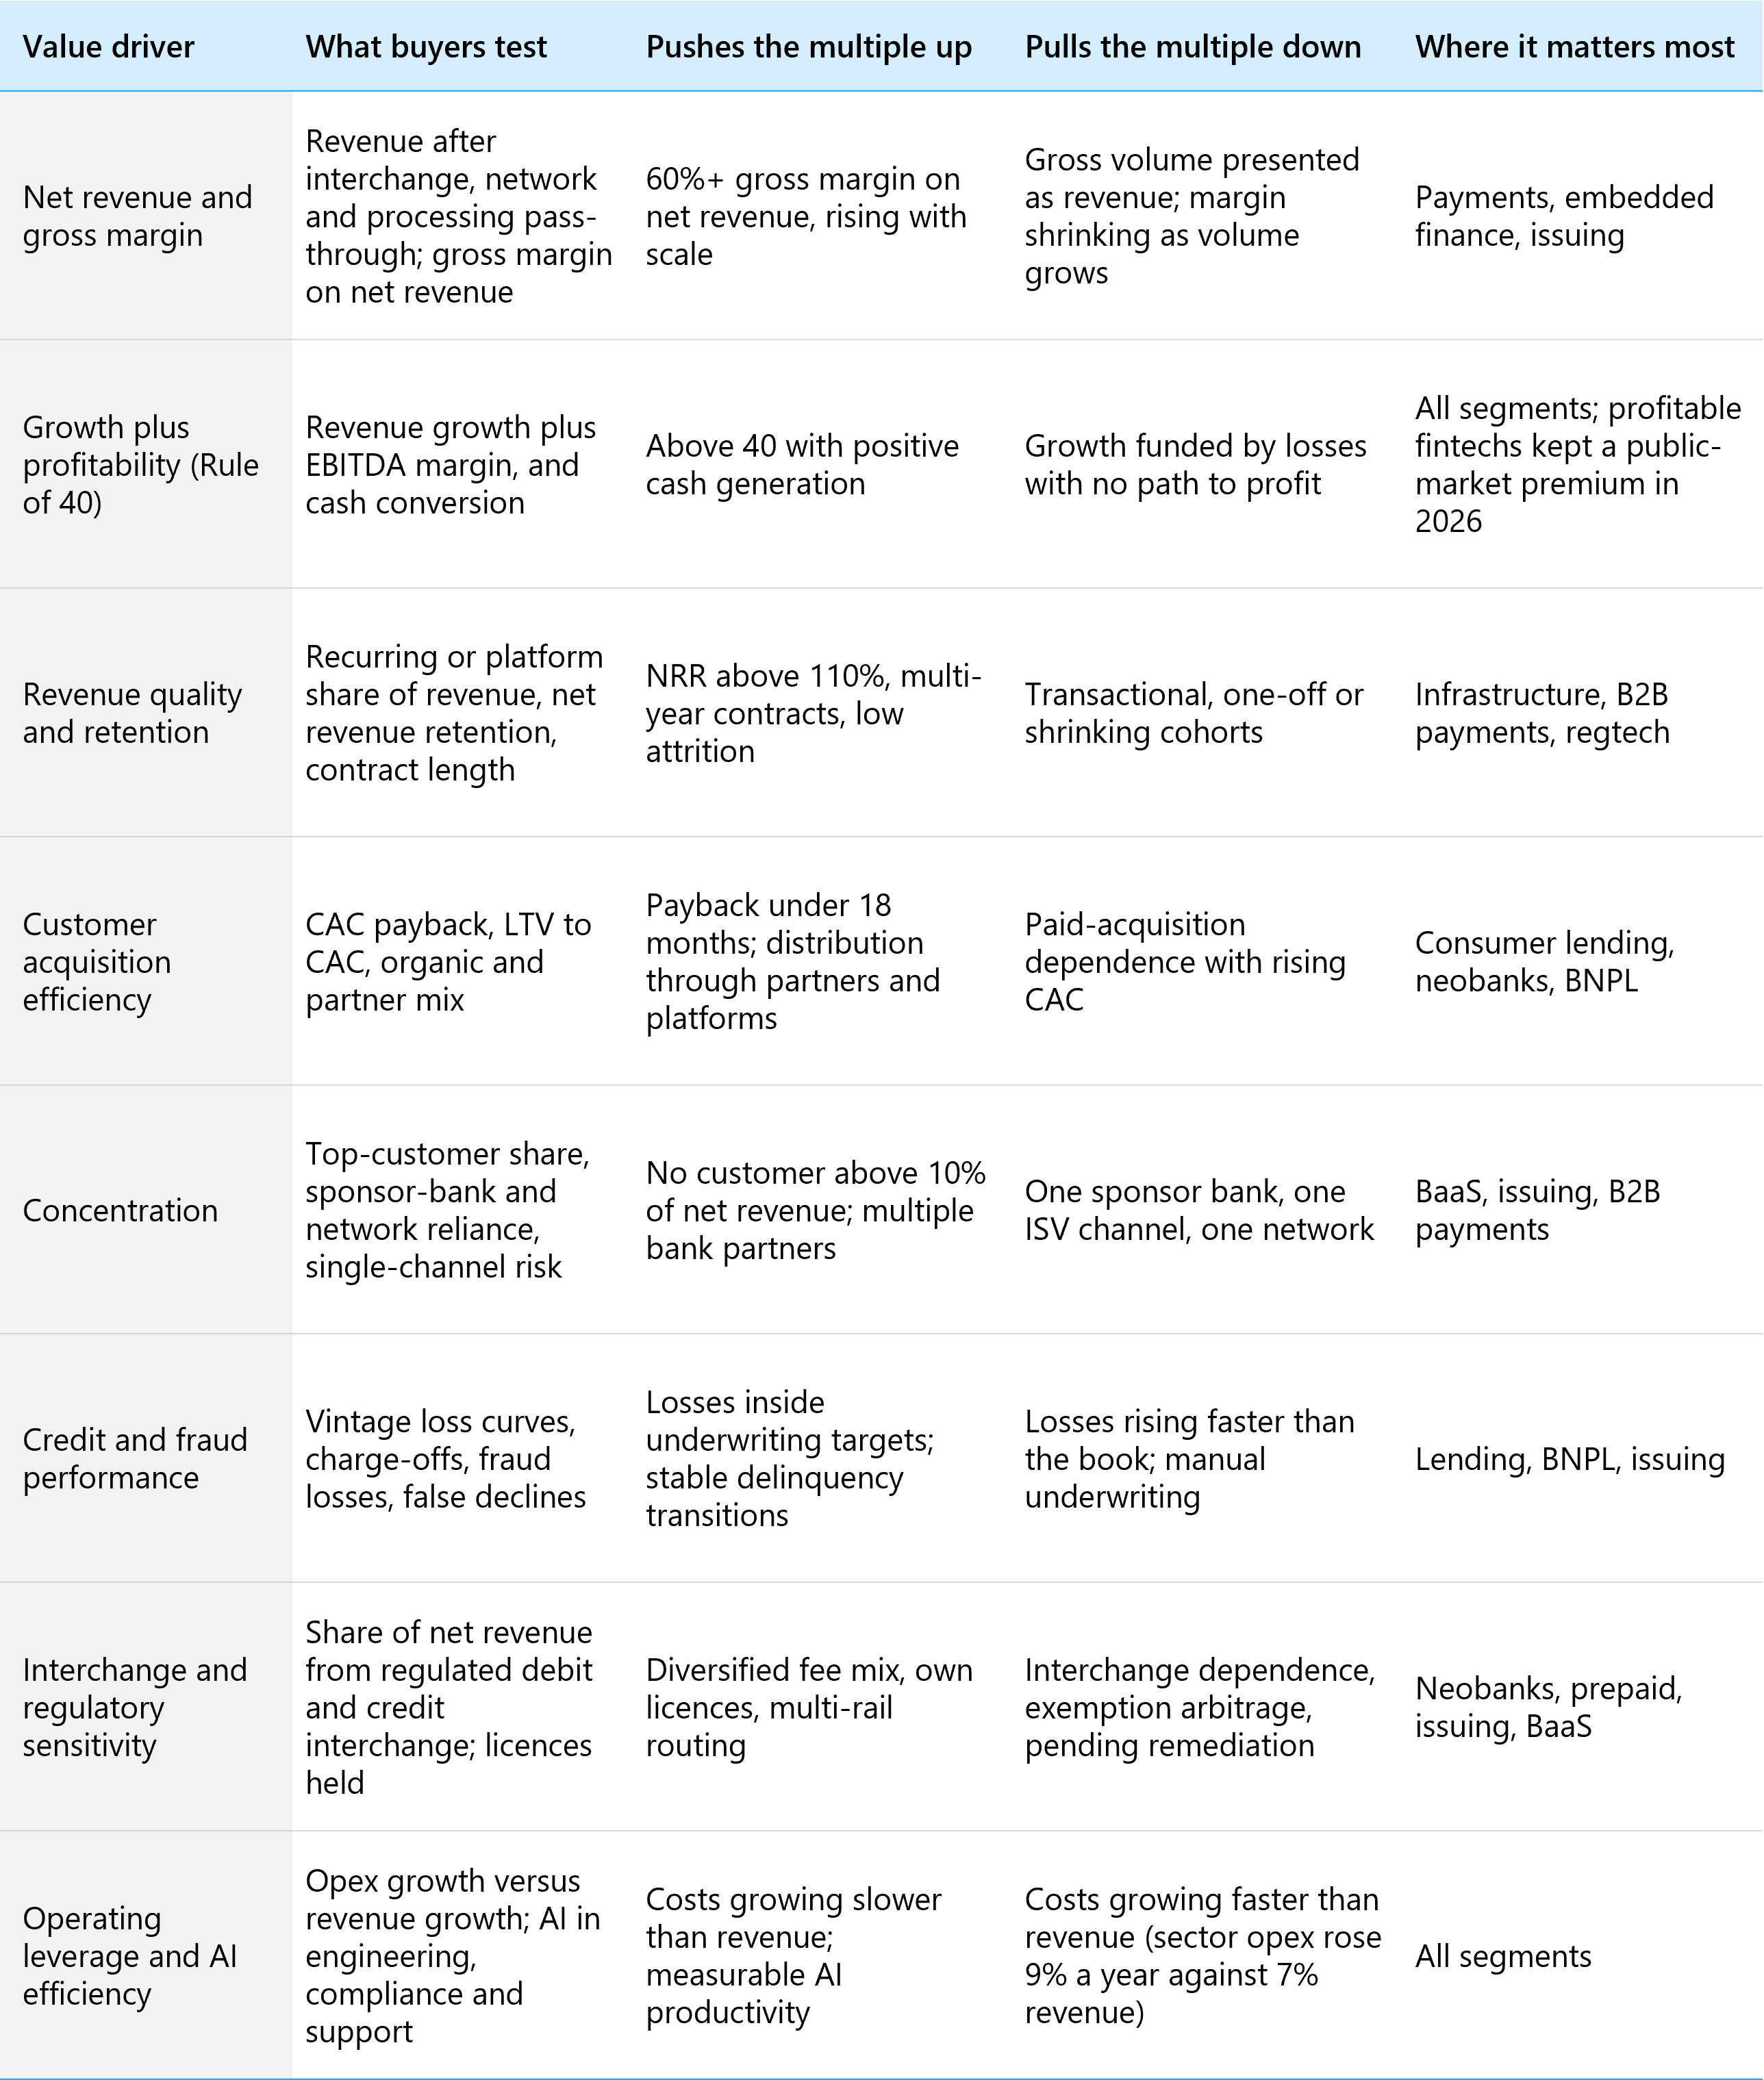
Size still matters, but not in the way it did. Capital in 2026 is concentrated: the ten largest fintech deals accounted for 62% of investment in the first half of the year. That concentration makes mid-market businesses with strong ratios stand out rather than disappear, because buyers who cannot win the megadeal are competing hard for the best $10 million to $100 million assets. It is also why fintech valuation multiples and market capitalisation move together only loosely: a $30 million net revenue infrastructure business with 115% retention can out-multiple a $300 million processor with flat volume.
Operating leverage deserves its own line because it is where most fintechs win or lose a turn of EBITDA. Payments IT spending is projected to grow about 9% a year through 2030, more than double the sector's revenue growth, while generative and agentic AI offer an annual operating productivity opportunity of up to $110 billion across customer operations, engineering, support functions and product development. Buyers now ask for evidence of that productivity in the numbers, and public investors have rewarded companies that show AI efficiencies alongside real operating momentum.
What Is the Private vs Public Fintech Valuation Gap in 2026?
Private and public fintech valuation multiples are being set by two different crowds in 2026, and sellers need to understand both. On the private side, fintech valuations reached record highs across stages in the second quarter and early-stage pricing kept setting records into the third quarter. The medians make it concrete: the global median pre-money valuation for early-stage fintech rounds rose to $64.1 million in 2026 to date from $36.9 million in 2025, later-stage rounds to $92.2 million from $46.0 million, and venture-growth rounds to $845.5 million from $636.0 million.
Public pricing is more measured, and that measure is useful. Most fintech cohorts traded below their 2025 year-end valuation levels through the third quarter of 2026, with investors rewarding clear catalysts: stronger guidance, better product momentum and demonstrated AI efficiencies. Listings were selective too: VC-backed fintech public listings produced $5.3 billion of exit value across 10 exits in the first half of 2026, against $64.9 billion across 30 in 2025, while total VC and PE exit value of $41.7 billion already exceeded the annual totals of 2022, 2023 and 2024. M&A carried the liquidity load: fintech M&A reached $67.9 billion across 394 deals in the first half, driven by two $10 billion-plus acquisitions, with cross-border deals accounting for $20.2 billion as corporates and fintechs bought scale and capability across borders.
What the gap means in practice: first, a late-stage private company's last round is not a valuation; buyers benchmark to public comps and add a control premium, so exits are priced from the public floor up, not from the private mark down. Second, strategic acquirers are the deepest pool of buyers, and they pay for capability rather than momentum. Third, category leaders can command private marks above public comps when growth and profitability are proven: Stripe was valued at $159 billion in a February 2026 tender offer in the same year a public payments leader received a bid at about 7x EBITDA and held out.

For a private seller the reading is clear and, on balance, favourable. Public multiples give buyers a defensible floor; strategic buyers are paying above it for scarce assets; and the sorting between profitable and unprofitable companies means a well-run mid-market fintech is being compared with the better half of the market, not the whole of it.
Public comps set the floor, strategic premiums set the ceiling, and a last private round sets neither.
Fintech Valuation Multiples in M&A Deals: Who Is Buying and Where
Strategic acquirers lead, and they are well funded. Corporate-led M&A held firm above $890 billion globally in the second quarter of 2026 while rising rates made leveraged buyouts harder to pencil, and a friendlier antitrust posture in Washington, Brussels and London gave corporate buyers more room to pursue scale. Private equity is back in fintech too: PE investment in fintech rose to $3.6 billion in the first half, including an eleven-quarter high of $2.6 billion in the second quarter, with PE deal volume rising while M&A and VC deal counts fell, and sponsors view payments as predictable, sticky and cash-generative, with consolidation expected to intensify in the second half.
Geography shapes both the buyer pool and the multiple. The Americas attracted $86.9 billion of fintech investment in the first half of 2026, $80.8 billion of it in the US, against $11.3 billion in EMEA and $4.6 billion in Asia-Pacific. Median deal sizes tell the same story: $126.5 million in the Americas, $70.0 million in EMEA and $11.4 million in Asia-Pacific in 2026 to date. US-based targets attract the deepest buyer pool and, all else equal, the highest fintech valuation multiples by region in 2026; European targets of similar quality trade at a discount that cross-border acquirers are actively arbitraging, which is an opportunity for sellers who run a process that reaches US buyers.
Emerging markets are valued on different rails. The Middle East, Africa and Latin America are expanding far faster than North America and Europe in payments revenue, and India attracted about $2 billion of fintech investment in the first half of 2026 in a selective Asia-Pacific funding environment. Where instant account-to-account networks carry most of the flow, buyers underwrite lending, software and data revenue rather than card interchange, because the rails themselves carry minimal fees. The multiple follows the revenue model, not the flag.
Venture flows set the pipeline for the next two years of exits. Fintech startups raised $10.8 billion across 536 VC deals in the third quarter of 2026 and $33.9 billion year to date, with payments leading on the back of Ant International's $1.2 billion Series A and early-stage valuations continuing to hit record highs. Funding rounds shape exit multiples in two ways: a round priced on a premium multiple sets expectations the next buyer will test against public comps, and a round from a strategic investor often becomes the first call in a sale process.

How Sellers Can Position a Fintech for a Premium Multiple in 2026
Most of the gap between fair and premium fintech valuation multiples is preparation. The businesses that cleared the top of their range in our 2026 processes shared the same habits, and none of them required changing the business model:
- Report net revenue, not gross. Build the bridge from volume to gross revenue to net revenue to gross margin, and make it reconcile to the audited accounts.
- Show cohorts. Retention, net revenue retention and, for lenders, vintage loss curves by origination quarter, so buyers can underwrite durability rather than guess at it.
- Run the interchange sensitivity before the buyer does. Split revenue by regulated debit, exempt debit, credit and non-interchange, and model the rewritten Regulation II standard and a sponsor-bank threshold crossing.
- Assemble the regulatory file. Licences, sponsor-bank and BIN contracts with term and change-of-control clauses, audit findings and remediation status, complaints data, and the board's risk reporting.
- Fix concentration early. Add a second sponsor bank or channel partner, and renegotiate any contract with a short term or a change-of-control trigger.
- Prove operating leverage. Show opex growing slower than revenue, with specific AI efficiencies in engineering, compliance and support that are visible in the P&L.
- Separate software revenue from processing revenue in the data room, with attach rates by cohort, so the software-led portion earns a software multiple.
- Get an independent valuation before you talk to anyone. Knowing your floor and your stretch case is what lets you run a competitive process rather than respond to one bid.
Timing helps too. Public listings were selective in the first half of 2026 while M&A carried the liquidity load, buyers are concentrating capital on proven businesses, and the regulatory calendar (a rewritten debit standard, charter approvals, the GENIUS Act and MiCA bedding in) is removing uncertainty rather than adding it. That combination favours well-prepared sellers who come to market with the numbers above in hand. If you want a confidential view of where your business sits in these ranges, get a free valuation from our fintech team.
Conclusion: Fintech Valuation Multiples Reward Preparation in 2026
Fintech valuation multiples in 2026 are being set by a market that is larger, more profitable and more selective than at any point in the sector's history: $251 billion of M&A in 2025, a median deal size that nearly doubled in the first half of 2026, and buyers concentrating capital on businesses with net revenue, retention and regulatory readiness they can underwrite. Payments, lending and infrastructure each have their own range, and within every range the difference between the bottom and the top is revenue quality, unit economics, interchange exposure and the licences a company holds in its own name.
If you own a fintech business and want to know where it sits, the fastest way to find out is to get a free valuation from FE International. Our team has advised on more than 1,500 completed technology transactions with a 94.1% success rate, and a confidential valuation gives you the floor, the stretch case and the preparation plan to close the gap between them.
