
.jpg)
LTV to CAC Ratio: What Benchmark Do Buyers Expect?
Almost every founder preparing for a sale has heard that three to one is the number to hit. Fewer have been told where that figure came from, what it assumes, or what happens when someone else recalculates it using their own assumptions rather than yours. The gap between those two things is where most unit-economics conversations in a sale process actually happen.
This page is about the benchmark rather than the definitions. If you want the formulas and what each input means, our guide to the metrics that drive a SaaS valuation covers those, and the wider question of what a business trades at is handled in our analysis of SaaS valuation multiples. What follows is narrower: what the expected benchmark is, how much of it rests on choices the seller makes, and what tends to happen when a buyer tests it.
One note on register before the detail. The benchmarks quoted here are published guidance written for operators, not thresholds any particular buyer applies. Nothing here predicts how a given ratio will be received in a negotiation.
The short answer
Three to one is the widely cited benchmark, and it is a reasonable starting point rather than a pass mark. The more useful point is that the ratio is an output of your own assumptions about customer lifetime, gross margin and what counts as acquisition cost. Buyers tend to recalculate it conservatively, and often lean on CAC payback period alongside it because that number is harder to flatter.
So the practical answer to what benchmark buyers expect is: one you can defend line by line, calculated on gross profit rather than revenue, with a lifetime assumption your actual retention data supports. A defensible 2.4 generally travels further than an unexplained 8.
Where the Three-to-One Benchmark Came From
The guideline entered general use through David Skok's SaaS metrics writing, and the most useful thing about that origin is how carefully he later qualified it. In a follow-up piece on the ratio, Skok is quoted acknowledging that he had made a significant mistake in not telling readers when it makes sense to compute LTV and CAC at all, because founders were calculating it long before the underlying numbers meant anything.
The same piece sets out when the ratio starts to carry information. It needs a repeatable, scalable sales motion behind it. Where a founder is closing deals personally, those deals and that salary arguably do not belong in the calculation at all, and early customers who arrived through existing relationships or received unusual levels of hands-on support do not represent how the business acquires customers at scale. The authors put it plainly: LTV to CAC ratios are to be used, not believed.
That caveat matters more in a sale than in a board meeting. A business at the size where an owner still does much of the selling is precisely the business whose ratio is least meaningful, and it is also a common profile among SaaS companies coming to market.
The Ratio Is an Output of Your Own Assumptions

The chart uses one invented business to make the central point. Revenue per customer, gross margin and acquisition cost are all held constant. The only thing that moves is the assumed monthly churn rate, and the ratio travels from 6.7 down to 1.3. Nothing about the business has changed; only a modelling input has.
This is not a hypothetical concern, because the lifetime assumption is usually the softest input in the calculation. ChartMogul's analysis of around 3,500 software companies, published in December 2025, puts median B2B net revenue retention at roughly 82 percent, with the top quartile near 97 percent. A median below 100 percent means the typical cohort is shrinking rather than expanding, which is difficult to reconcile with the long customer lifetimes that flattering LTV figures tend to assume. Our guides to net revenue retention and SaaS churn benchmarks cover how those figures are built.
The wider point is not new. Academic and practitioner criticism of customer lifetime value calculations goes back decades: writing in Harvard Business Review in 2007, Detlef Schoder argued that the standard approach is flawed because it overlooks management's option to abandon unprofitable customers. Different objection, same underlying lesson. LTV is a model, and a model inherits every assumption you feed it.
Four Choices Inside the Calculation
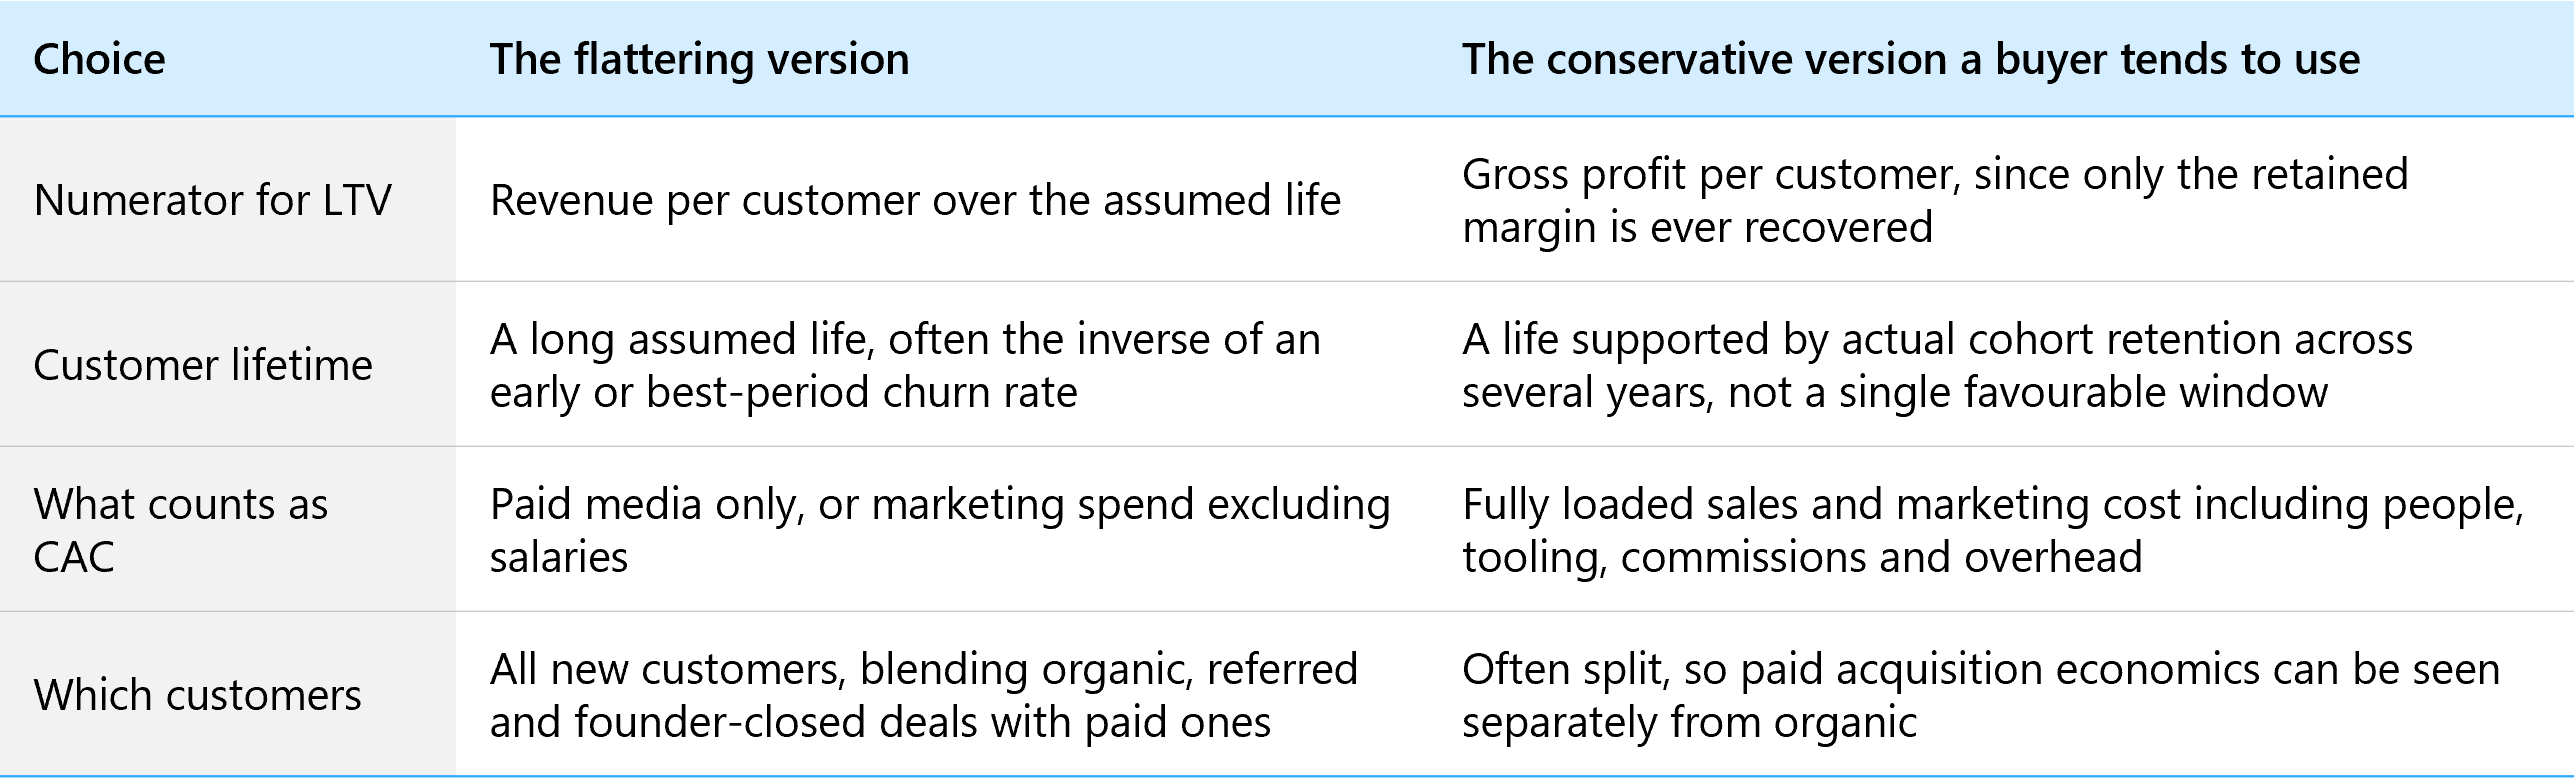
The gross margin choice in particular changes the answer materially. ChartMogul makes the underlying logic explicit: a company only actually recovers the margin it keeps from each customer, not their gross revenue, with mature SaaS businesses generally running somewhere in the 70 to 85 percent range. On an 80 percent margin, a revenue-based LTV overstates by a quarter before any other assumption is examined.
None of these four choices is governed by a standard. Neither LTV nor CAC has an accounting definition, and the absence is recognised well beyond private M&A: the SEC's guidance on presenting key performance indicators asks issuers to define the metric and explain how it is calculated precisely because operating metrics without stated methodology are not comparable between companies. Those rules do not bind a private seller. The expectation they reflect tends to arrive anyway, because the buyer's advisors were generally trained under them.
A Very High Ratio Does Not Always Read Well
This is the part that surprises founders most. An LTV to CAC of eight or ten is often presented as a headline strength, and it can be read the other way.
A ratio that high generally says one of two things. Either the calculation is generous, which is the first thing a buyer will test, or the business is genuinely acquiring customers far more profitably than it is spending against that opportunity. The second reading is a real finding, and it tends to prompt a question rather than applause: if each customer is worth several times what it costs to win, why is more not being spent on winning them?
For a buyer that can cut either way. Underinvestment can be framed as headroom, since a well-capitalised acquirer may see an obvious opportunity to spend into a proven channel. It can also be framed as a ceiling, if the reason spending has not increased is that the channel does not scale, the addressable market is thinner than it looks, or unit economics decay quickly as cheaper sources of demand are exhausted. Skok's own framing anticipates this, noting that companies are forced to add more expensive channels as they scale, which changes what the historic ratio predicts.
Which reading applies is usually settled by channel-level evidence rather than by the headline figure, which is one of several reasons our note on what buyers look for in a SaaS acquisition treats concentration in a single acquisition channel as a risk in its own right. Where growth depends heavily on one source of demand, our overview of B2B marketing for SaaS companies is a reasonable place to start on diversifying it.
Why CAC Payback Travels Better

CAC payback asks how many months of gross profit it takes to recover what was spent winning a customer. It uses the same inputs minus the most contestable one, because it never requires a view on how long the customer stays. That makes it considerably harder to flatter, and it is why it tends to appear alongside the ratio rather than instead of it.
Published guidance varies by who you sell to. Bessemer's scaling guidance, written in 2021, suggests targeting payback under 12 months for SMB-focused companies, under 18 for mid-market and under 24 for enterprise, on the reasoning that larger deals justify longer recovery periods. Skok's writing points in a similar direction, describing months to recover CAC as an even more powerful metric in the early stages and suggesting recovery inside 12 months keeps capital requirements manageable.
Bessemer's later work on profitable growth adds useful surrounding context, including a median gross margin of around 77 percent among high-growth public cloud companies and a suggested 8 to 10 times spend-to-pipeline ratio when reviewing acquisition cost by channel. Those are operator targets rather than acquisition criteria, but they indicate the frame a financially literate buyer is likely to arrive with.
What a Buyer Does With the Number
Expect the figure you present to be rebuilt rather than accepted, in much the same way the earnings figures are. Three things tend to happen.
The scrutiny has a straightforward commercial reason behind it. Bain's mid-2026 read of private equity notes that a deal which a decade ago needed roughly 5 percent annual earnings growth to reach a target return now needs something closer to 12 percent, with multiple expansion no longer doing the work it once did. When the return has to be generated by growing the business, how efficiently that business acquires customers stops being a slide and starts being an underwriting assumption.
The inputs get restated. LTV is usually recalculated on gross profit, CAC on fully loaded sales and marketing cost. Where marketing salaries have been treated as overhead rather than acquisition cost, that treatment is generally revisited, and the same scrutiny that applies to EBITDA add-backs applies here.
Cohorts replace averages. A blended ratio across all customers since inception says less than retention and expansion by cohort over time. Cohort data is one of the more commonly requested items in a SaaS due diligence process, and it appears on most buyer-side checklists. Where annual prepayments are involved, how deferred revenue is handled can also shift the picture.
The numbers get tied back to the accounts. Unit economics that cannot be reconciled to reported sales and marketing spend tend not to survive a quality of earnings analysis. FE International's quality of earnings service exists partly because this reconciliation is easier to do before a buyer does it than afterwards. How much weight the exercise carries varies by acquirer, and our comparison of private equity, strategic and individual buyers sets out why.
What Changes by Segment and Model
There is no single expected benchmark across SaaS, because the same ratio means different things in different models.
A low-priced, self-serve product with high volume and short sales cycles can support a fast payback and will usually be judged against that. An enterprise product with long cycles and large contracts carries higher acquisition costs by design, and is generally assessed on longer payback with expansion doing more of the work. Comparing the two on a single threshold produces a misleading answer in both directions, and it is one reason the multiple itself varies so widely across otherwise similar businesses.
Businesses with a significant AI component sit slightly outside the conventional frame again, because inference and infrastructure costs scale with usage and compress the gross margin that both LTV and payback depend on. Where that applies, the margin assumption deserves more attention than the ratio. Our notes on valuing AI businesses and how valuation models are adapting cover where that thinking currently sits, and the mid-year 2026 tech M&A report gives the market backdrop.
What to Have Ready
The preparation that tends to pay off is documentation rather than optimisation.
Write down your LTV and CAC definitions, stating explicitly whether LTV uses revenue or gross profit and what is included in acquisition cost. Produce cohort retention by signup period rather than a blended average, covering enough periods to show a trend. Show CAC payback alongside the ratio, calculated on gross profit. Split paid from organic acquisition so the economics of each are visible. And reconcile total acquisition spend to the sales and marketing line in the accounts, because that reconciliation is the one most often requested and least often ready.
Most of this sits inside what a preparation checklist would cover anyway, alongside the wider document pack a process requires. Doing it early is generally the difference between explaining a number and defending one, and the structural work behind a better ratio belongs in exit planning rather than in the months before a sale, where changes to acquisition spend are visible and invite questions. The full arc is set out in our guide to how to sell a SaaS business.
Where This Leaves You
The honest answer to what benchmark buyers expect from an LTV to CAC ratio is that they expect a number they can rebuild. Three to one remains the reference point, and the work that changes how it is received is showing the inputs, calculating on gross profit, supporting the lifetime assumption with cohort evidence and presenting payback alongside it.
If you want to see how your own unit economics look once they are calculated the way a buyer would calculate them, you can request a confidential valuation, or read how FE International handles SaaS sales end to end. For the wider question these numbers feed into, our note on how much a business is worth is the place to go next.
