
.jpg)
What Is the Rule of 40, and How Does It Affect Valuation?
The Rule of 40 is the most quoted number in software finance and one of the least carefully calculated. It compresses two things a buyer cares about, how fast a business is growing and how much it keeps, into a single figure that fits in a sentence. That compression is what makes it useful in a first conversation and what makes it misleading if it is the only thing you bring to a valuation discussion.
This page covers the mechanics: where the score came from, how it is calculated, which of its inputs tend to get challenged, and what typically happens to the number once a buyer rebuilds it from your accounts. For the wider question of what your business might actually trade at, our analysis of SaaS valuation multiples by ARR band, growth and retention is the better starting point, and this page assumes you have read it or will.
One framing note. Nothing here is a promise about what a particular score will produce. The relationships described are patterns observed across published data sets, mostly public-company data, and a private sale is negotiated rather than calculated. Treat the rule as a diagnostic, not a pricing formula.
The short answer
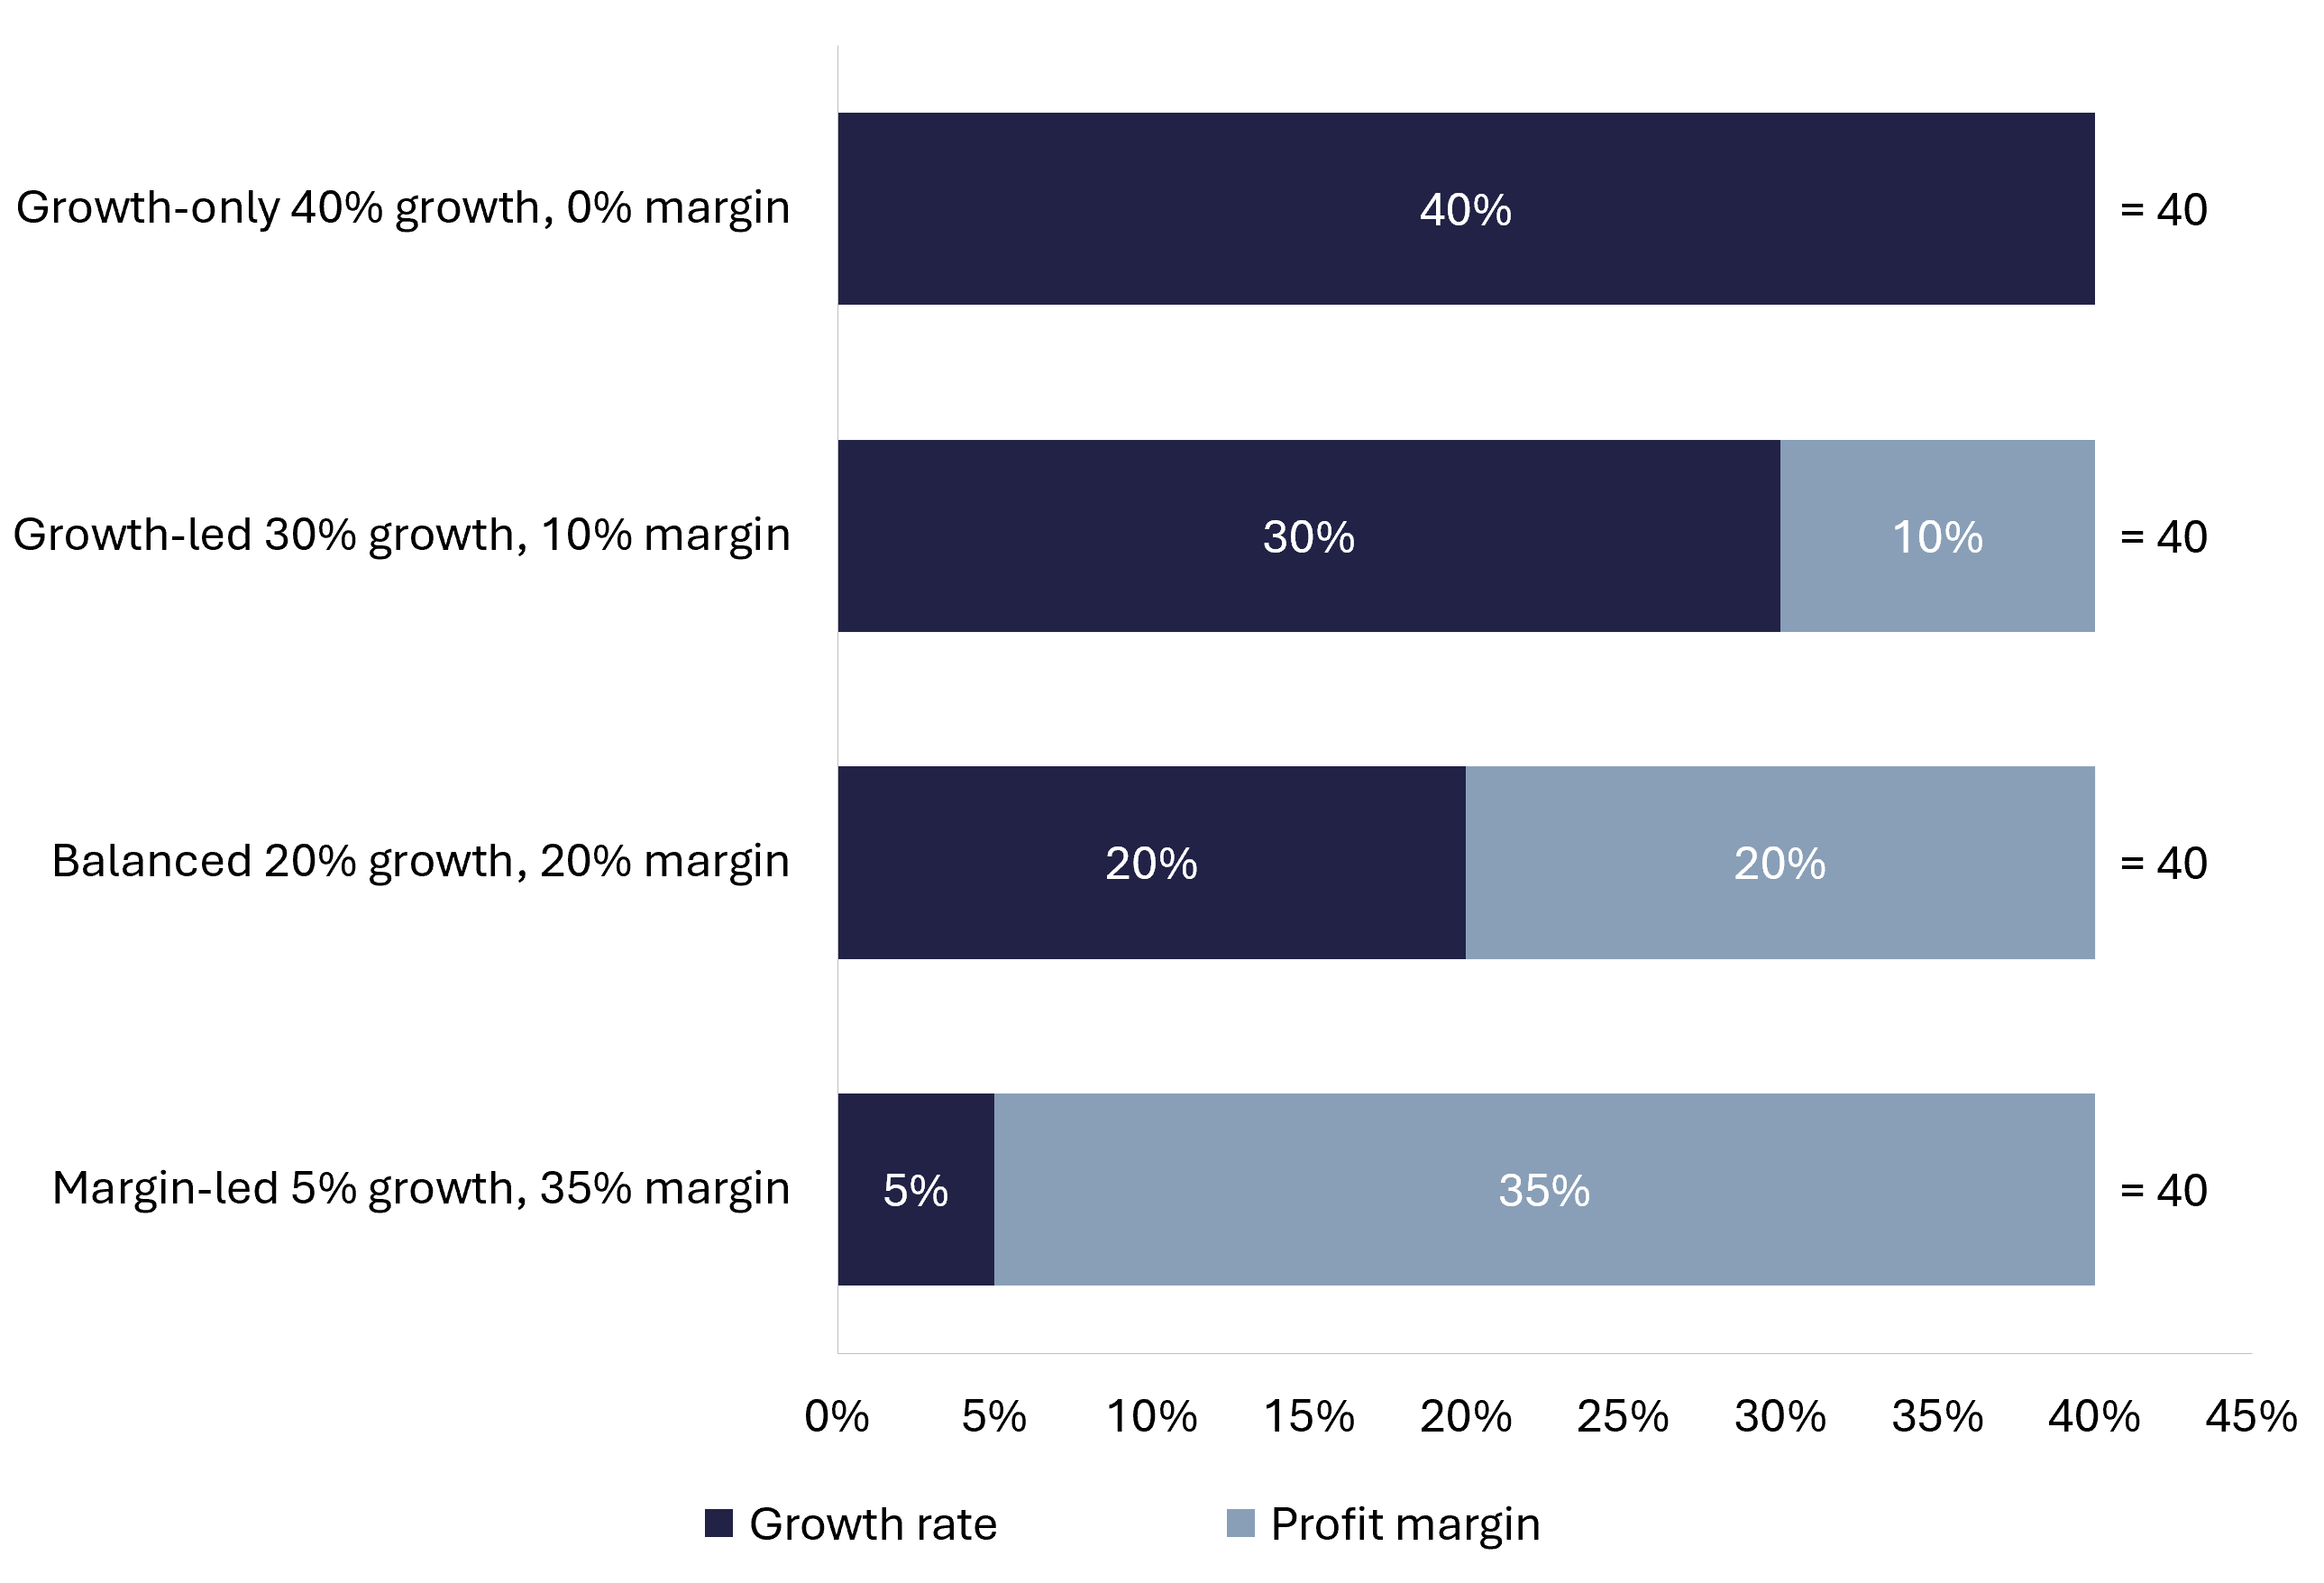
The Rule of 40 adds your revenue growth rate to your profit margin and asks whether the total reaches 40. It affects valuation mainly as a screen and a shorthand: clearing it tends to keep a business in the conversation, while the actual multiple is decided by which half of the score is doing the work, how durable it looks, and what survives diligence.
The part most summaries leave out is that the rule is agnostic about composition and buyers are not. Two businesses can both score 40 and be valued very differently, because a point of growth and a point of margin do not carry the same weight in the market. That gap between the arithmetic and the pricing is the substance of this page.
Where the Rule of 40 Came From, and Who It Was Built For
The rule entered general circulation through a 2015 post by Brad Feld, who credited it to a late-stage investor describing how their firm assessed software businesses. The formulation was simple: growth rate plus profit should add up to 40. Growing at 20 percent, you should be making 20 percent. Growing at 40 percent, breaking even is acceptable. Growing at 50 percent, losing 10 percent is defensible.
Two details from that original framing matter more than they are usually given credit for. Feld was explicit that the rule applied to SaaS companies at scale, suggesting at least $50 million in revenue as the point where it becomes meaningful. And the profit half was understood loosely, with EBITDA as the working baseline rather than a defined standard.
The institutional versions inherited both the logic and the scale assumption. McKinsey's treatment of the metric defines it as ARR growth plus trailing twelve-month free cash flow margin and frames that specification for companies above roughly $600 million in revenue. Almost every published benchmark you will find sits in that world. Almost no founder reading this does, which is the first reason to be careful with the number.
How the Score Is Calculated, and Where It Goes Wrong
The arithmetic is trivial. The definitions are not. Four choices sit inside the calculation, and moving any one of them can shift a score by ten points or more without anything changing in the business.
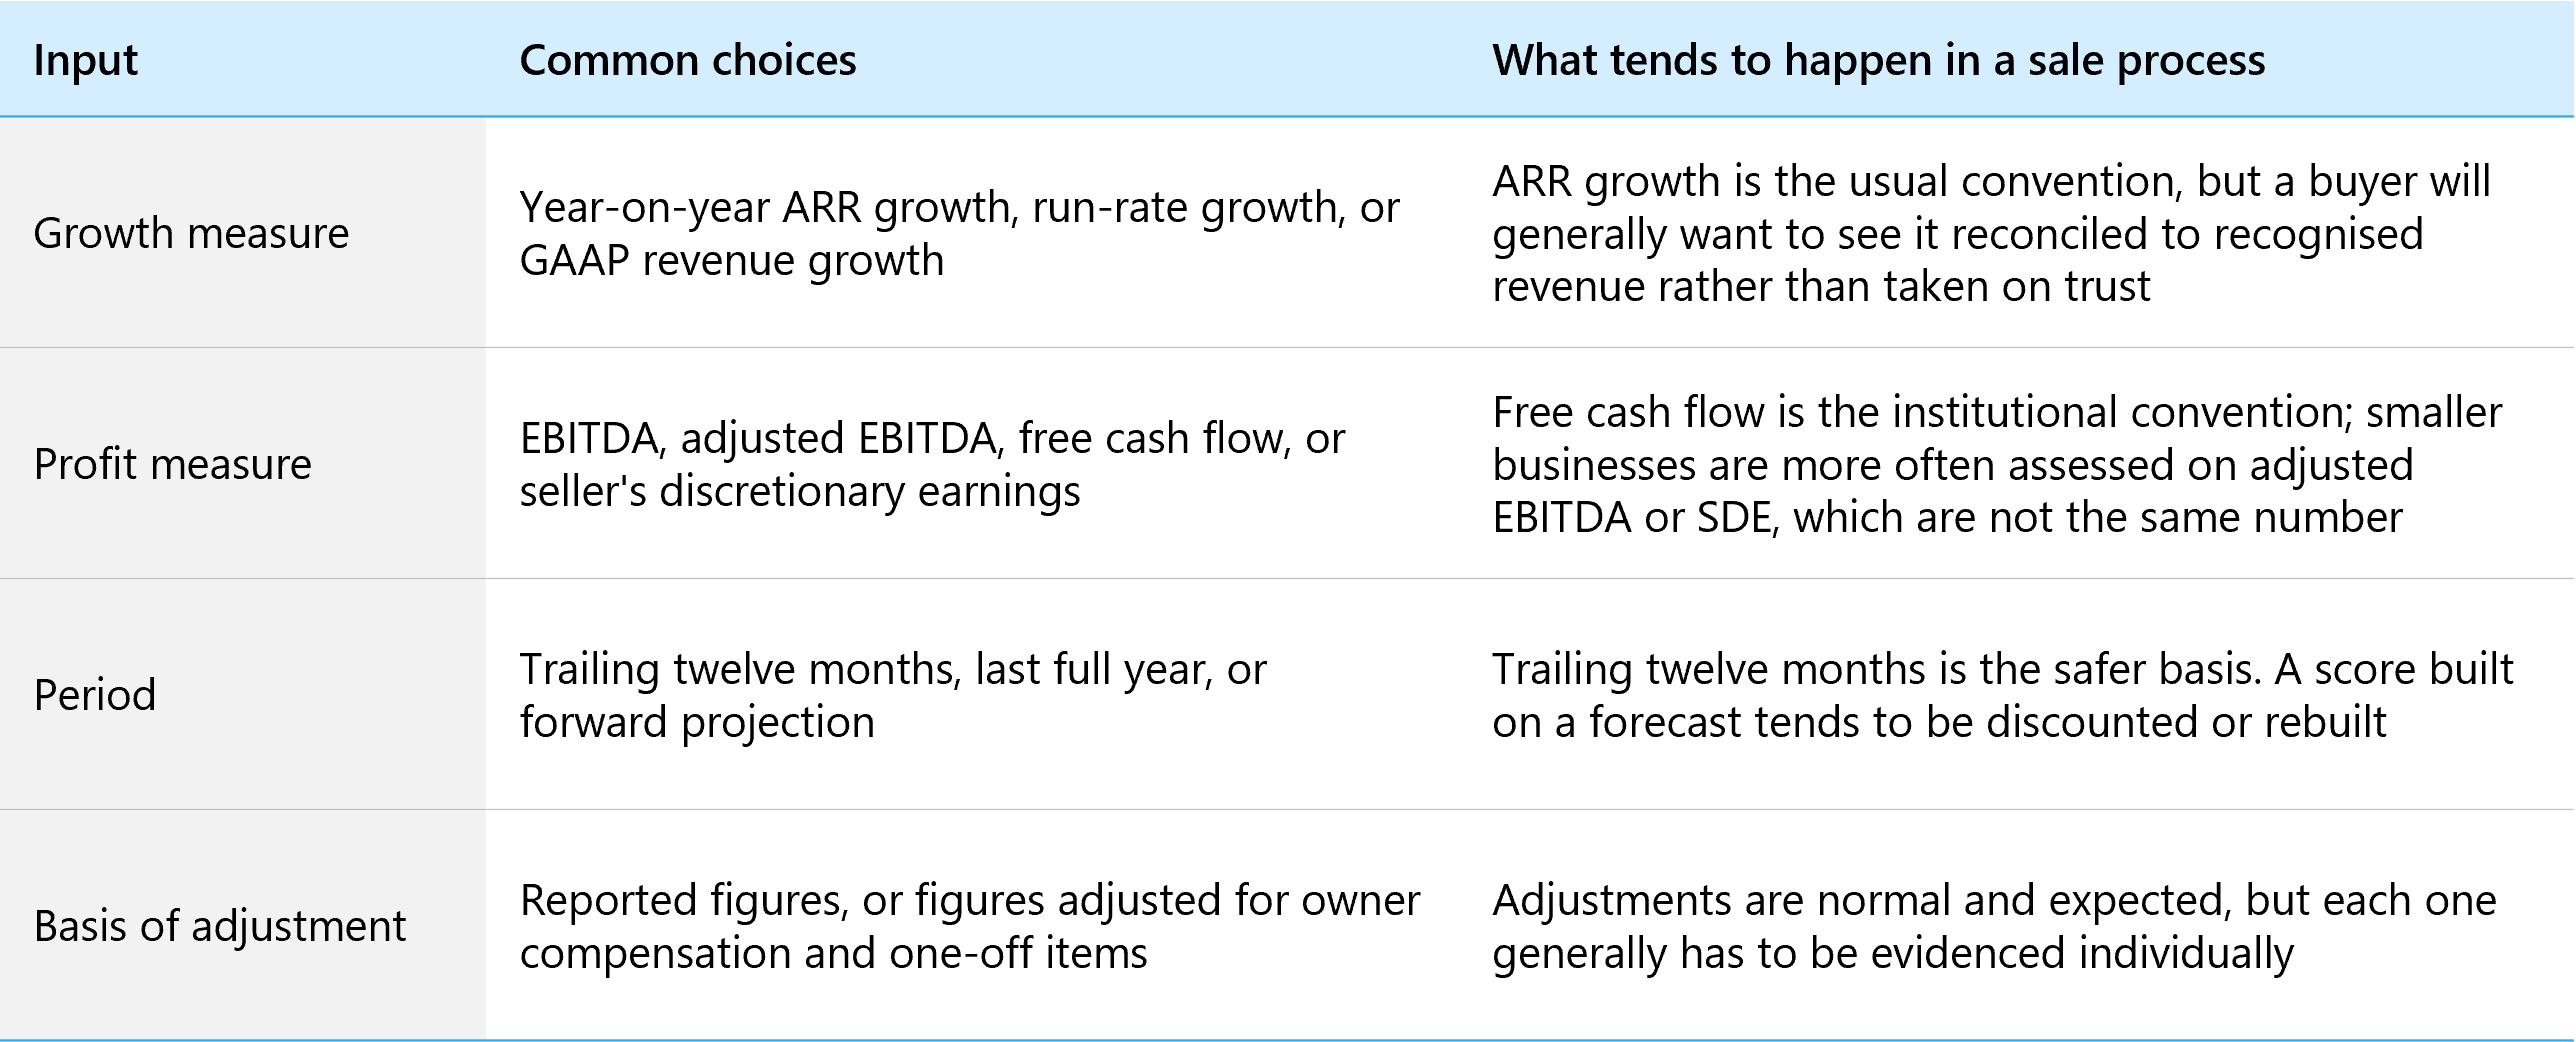
The absence of a standard is worth dwelling on. Unlike a GAAP measure, there is no authority that defines the Rule of 40, so a score quoted without its inputs carries very little information. Even in public markets, where adjusted figures face real scrutiny, the SEC maintains extensive guidance on non-GAAP measures precisely because adjusted earnings can be presented in ways that flatter. A private buyer has no equivalent rulebook to lean on and generally compensates by rebuilding the numbers themselves.
Why a Growth Point and a Margin Point Are Not Worth the Same
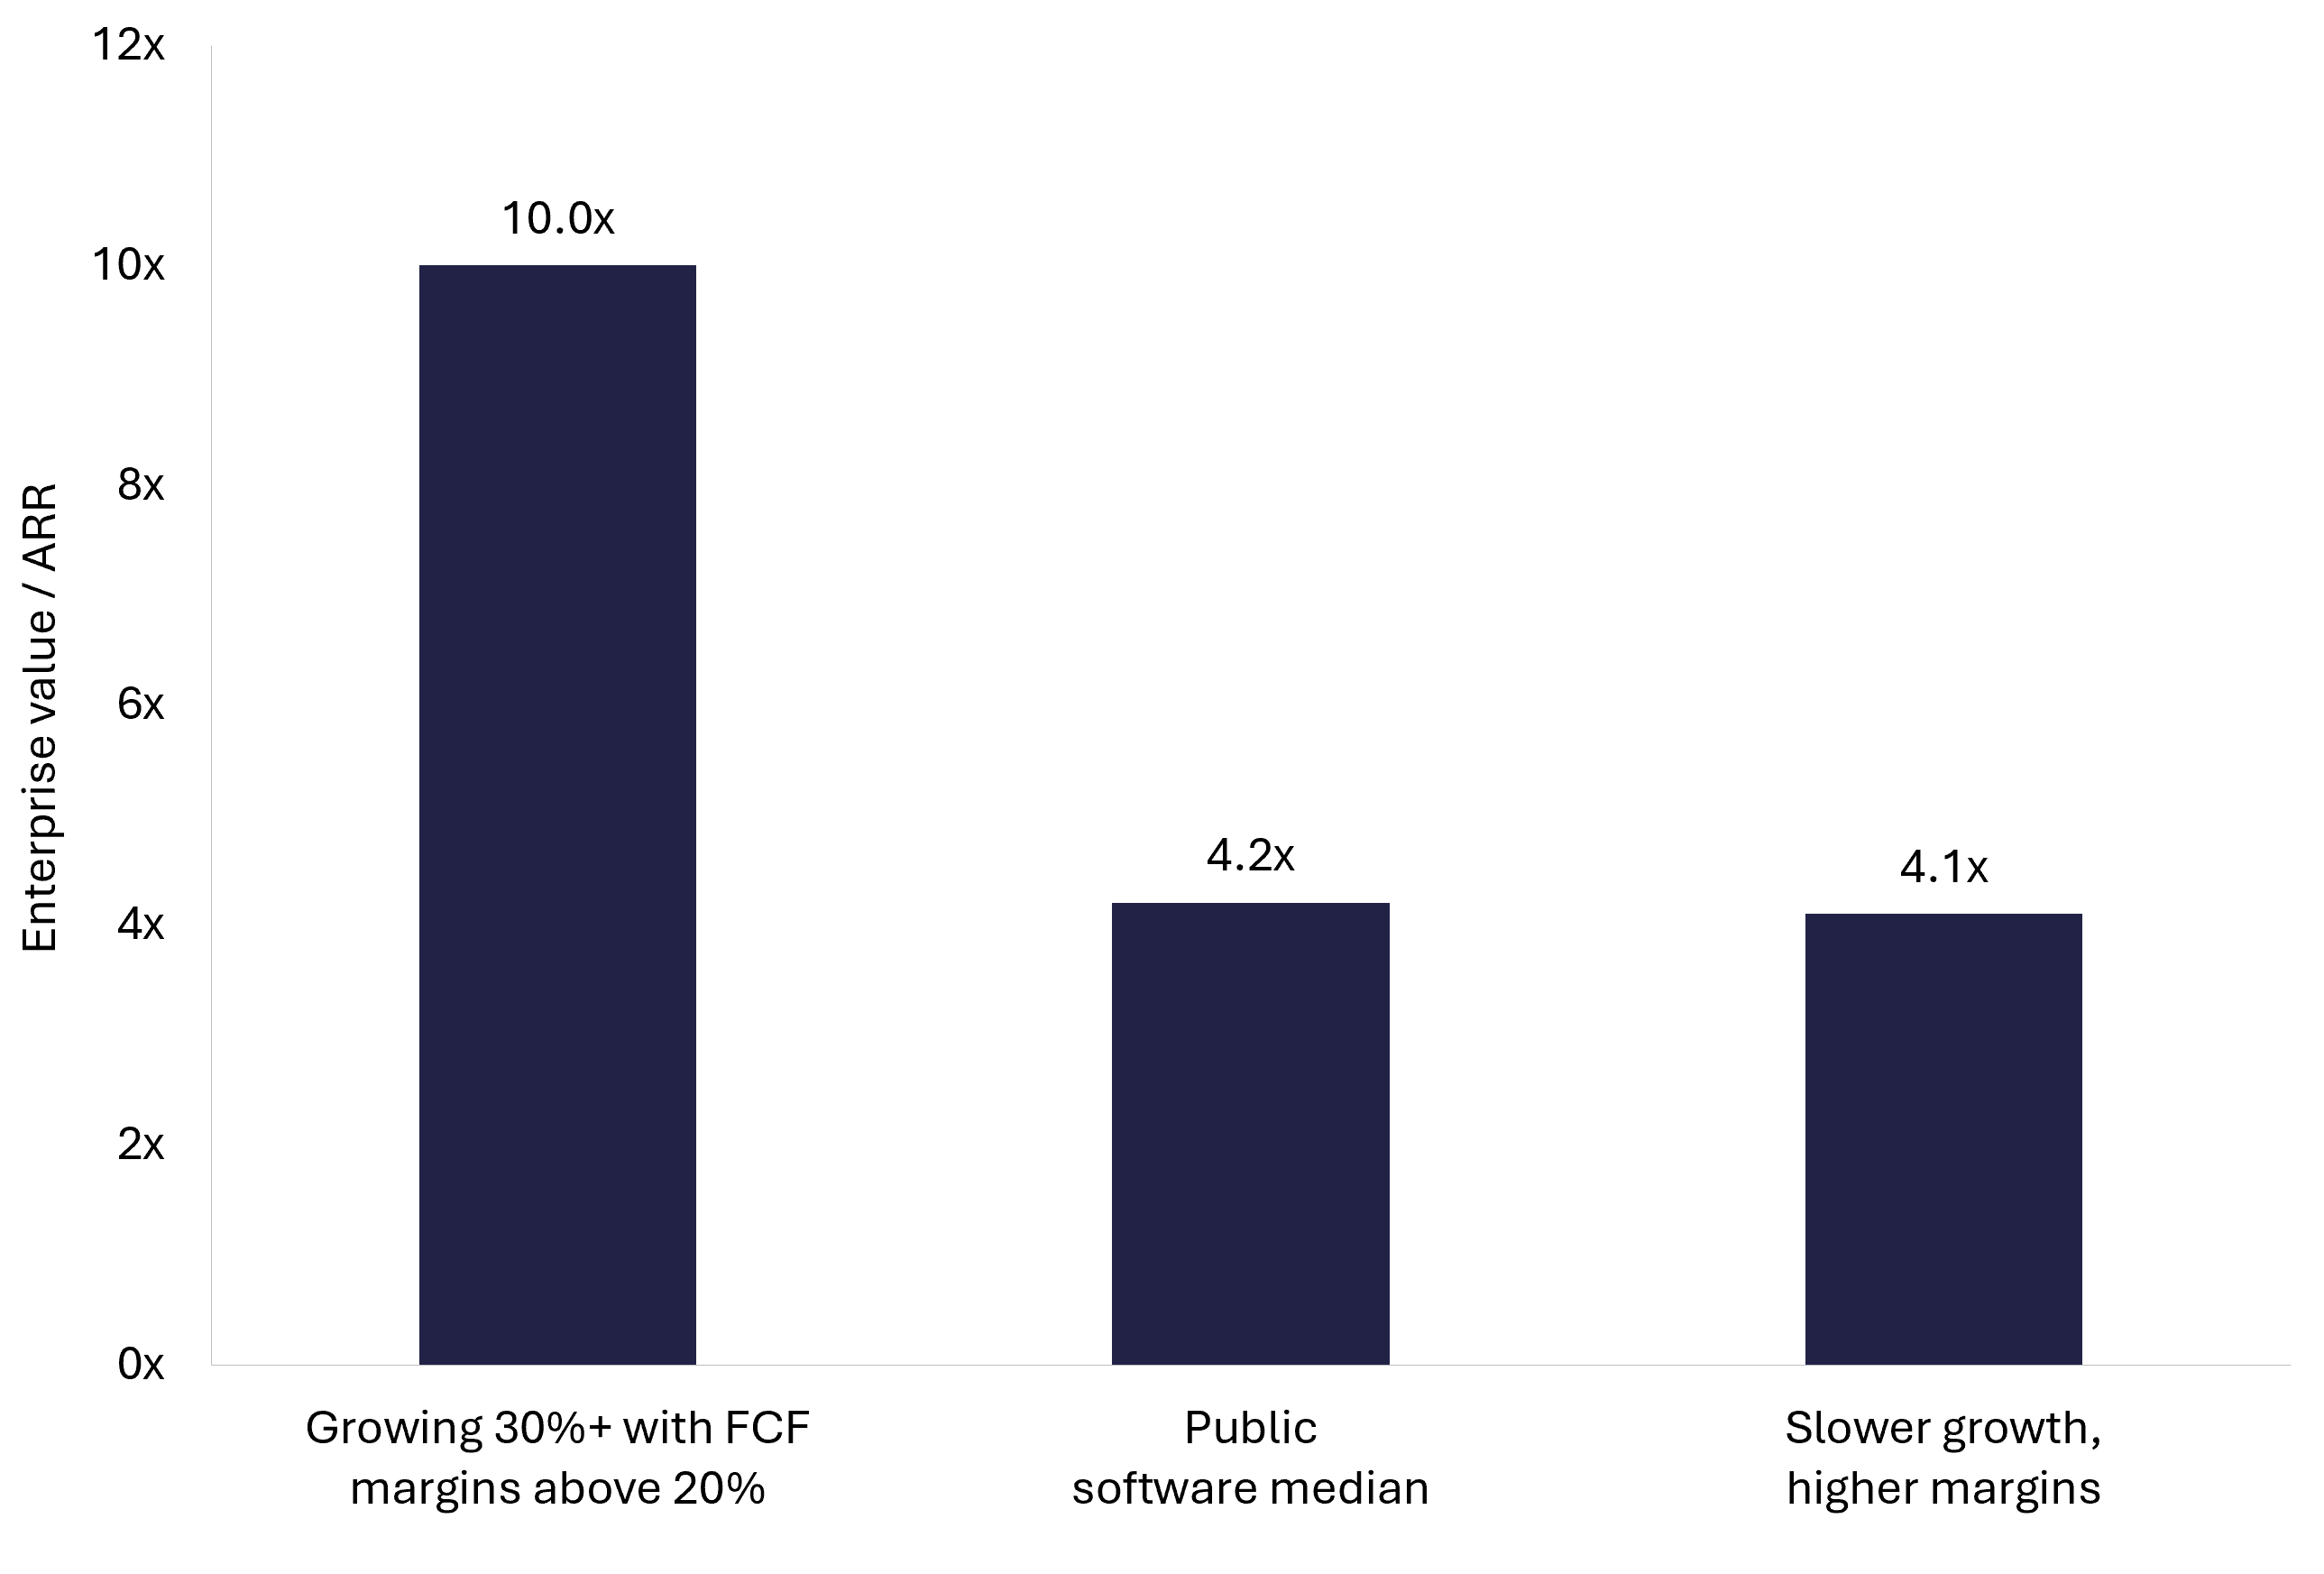
This is where the rule quietly breaks. It adds the two halves as if they were the same currency. The published evidence consistently suggests they are not.
Meritech's September 2026 read of public software puts growth at roughly 4.2 times more strongly correlated with the multiple than free cash flow margin, with high-growth profitable companies trading near 10.0x ARR against a median around 4.2x. Bessemer reached a similar conclusion from a different direction and built the Rule of X, which weights growth by a multiplier of roughly two for private companies before adding margin. In their testing the weighted version explained materially more of the variation in valuation than the unweighted one.
McKinsey's work on efficient growth points the same way, suggesting that for a company operating at the 40 threshold the preferred ratio of growth to margin sits somewhere between roughly 1.2 and 2.1 to one in favour of growth. None of this means margin is unimportant. It means that if you are choosing which half of your score to improve before a sale, the two options are unlikely to be equivalent, and that is a conversation worth having with an advisor before you act rather than after.
What Happens When a Buyer Recomputes Your Score
Assume the score you present will not be the score a buyer works with. That is not a sign of bad faith on either side; it is what diligence is for. Three areas account for most of the movement.
Add-backs. Owner salary above or below market, one-off legal costs, personal expenses run through the business and discontinued experiments are all commonly adjusted. Each generally needs to be evidenced separately, and our guide to EBITDA add-backs covers which ones tend to survive scrutiny and which do not. Add-backs that cannot be documented are usually the first thing to come out.
Revenue recognition. Annual prepayments, multi-year contracts and usage-based components can all make a run-rate figure look different from recognised revenue. How deferred revenue is treated in a SaaS acquisition affects both the growth half of the score and the working capital discussion later, and the two are often negotiated together.
Quality of earnings. On larger processes a buyer may commission a quality of earnings analysis that rebuilds the numbers from source. Sellers who have already been through the exercise internally tend to find the process less disruptive, which is part of why it appears on most preparation checklists well before a business goes to market. Our note on what documents you need to sell a SaaS company sets out what usually has to be in place for any of this to be verifiable.
The Rule Travels Badly Below $10m ARR
A rule designed for companies above $50 million in revenue does not transplant cleanly onto a business doing $2 million, and applying it literally at that size can produce conclusions that are close to backwards.
Start with the growth half. ChartMogul's benchmarking across more than 2,100 SaaS businesses puts median annual growth at around 30 percent, with faster rates concentrated in the earliest stages and in the top decile. A smaller business growing at 30 percent and running at 25 percent owner-adjusted margin scores 55, which reads as exceptional against public benchmarks and tells a buyer almost nothing they could not see from the two underlying numbers.
Then the margin half. Owner-operated businesses are typically assessed on seller's discretionary earnings rather than free cash flow, because the founder's own compensation is a policy choice rather than a market rate. Our guide to the metrics that actually move a SaaS valuation sets out how those bases differ, and the broader question of how much a business is worth rarely resolves to a single efficiency score at this size.
What generally carries more weight in this range is retention. Net revenue retention and gross churn describe whether the revenue base holds up without constant replacement, which is the question behind the growth figure rather than beside it. The pillar covers how those inputs interact with the multiple itself.
What the Score Actually Does in a Private Sale
In practice the Rule of 40 tends to function in three ways, none of which is pricing.
It works as a screen. Financial and strategic buyers running a wide funnel need a fast way to sort inbound opportunities, and a single efficiency figure does that job. Clearing the bar tends to keep a business in the conversation; falling short tends to invite a question rather than an automatic no, particularly where the shortfall is deliberate reinvestment.
It works as a narrative device. A score is a compact way to open the argument about why a business is worth what it is asking, which is why the metric commonly appears early in the confidential information memorandum. What follows the number matters more than the number, and different acquirers weigh it differently, as our comparison of private equity, strategic and individual buyers sets out.
It works as a durability question. A single strong year is easier to produce than three consecutive ones, and buyers tend to ask which they are looking at. McKinsey's study of more than 200 software companies over a decade found the threshold was cleared only about 16 percent of the time, which is a useful corrective to the impression that 40 is a normal outcome. Sustained performance is treated as evidence of something structural; a single year is more often treated as a data point to test in diligence.
What AI Spending Is Doing to the Margin Half
The economics the rule was built on assumed software gross margins that stayed high as revenue scaled. Inference costs, model access and the infrastructure behind AI features have introduced a variable cost line into businesses that previously had very little of one.
Bain's April 2026 analysis of the effect describes a high-growth marketing technology company whose revenue rose 38 percent while its costs rose 349 percent over the same period, largely on AI infrastructure and hosting. Their framing is a fork rather than a prescription: limit AI spending and protect cash generation, or reinvest and accept a lower score for a period while competing with AI-native entrants.
For a seller the practical consequence is that a depressed margin half now needs explaining rather than apologising for. Buyers assessing AI-enabled software businesses are generally distinguishing between spending that is building a durable capability and spending that is holding position, and our note on how AI is reshaping valuation models covers where that distinction is currently being drawn. The mid-year 2026 tech M&A picture gives the wider market context.
What to Do With Your Score Before You Go to Market
A few things tend to be worth doing, and one tends not to be.
Calculate it on a trailing twelve-month basis and write down the inputs alongside the result, so the score can be defended rather than asserted. Calculate it a second way, on reported figures with no adjustments, and know the gap between the two before a buyer finds it. Look at the composition rather than the total, because that is what the pricing evidence suggests is being read. And look at the trend across three years, since durability is the question underneath the number.
The thing that tends not to work is engineering the score in the months before a sale. Cutting sales and marketing lifts margin quickly and shows up in growth shortly afterwards, usually while the process is still running. Buyers reviewing what they look for in a SaaS acquisition generally examine the shape of spending, not just its level, and a margin improvement that coincides with a sale process invites the obvious question. Structural work of this kind sits better in exit planning a year or two out, which is also roughly the horizon our note on how long a sale takes would suggest.
Where This Leaves You
The Rule of 40 is a good question and a poor answer. It gets a founder to look at growth and profitability together, which is more than most single metrics achieve, and then stops exactly where the interesting part begins. The composition of the score, the durability of it and what survives a buyer's own rebuild are where the valuation conversation actually happens.
If you are working out where your business sits, the useful next step is usually to see the score calculated properly on a defensible basis alongside the metrics that sit around it. You can request a confidential valuation to have that done, or read how FE International handles SaaS sales end to end. For the process itself, our guide to how to sell a SaaS business covers what happens from preparation through to close.
