

Private SaaS businesses trade at roughly 2x to 7x ARR in 2026, with the range set by scale, growth, and retention rather than by sector averages. Public enterprise SaaS trades near 3.3x trailing revenue. Companies clearing the Rule of 40 with net revenue retention above 120% reach the top of the range.
That is the short answer. The longer answer is the one that actually determines your exit price, because the spread inside those ranges is enormous. Two SaaS companies with identical ARR routinely sell for prices that differ by a factor of three, and the difference has almost nothing to do with the sector average either of them read about online.
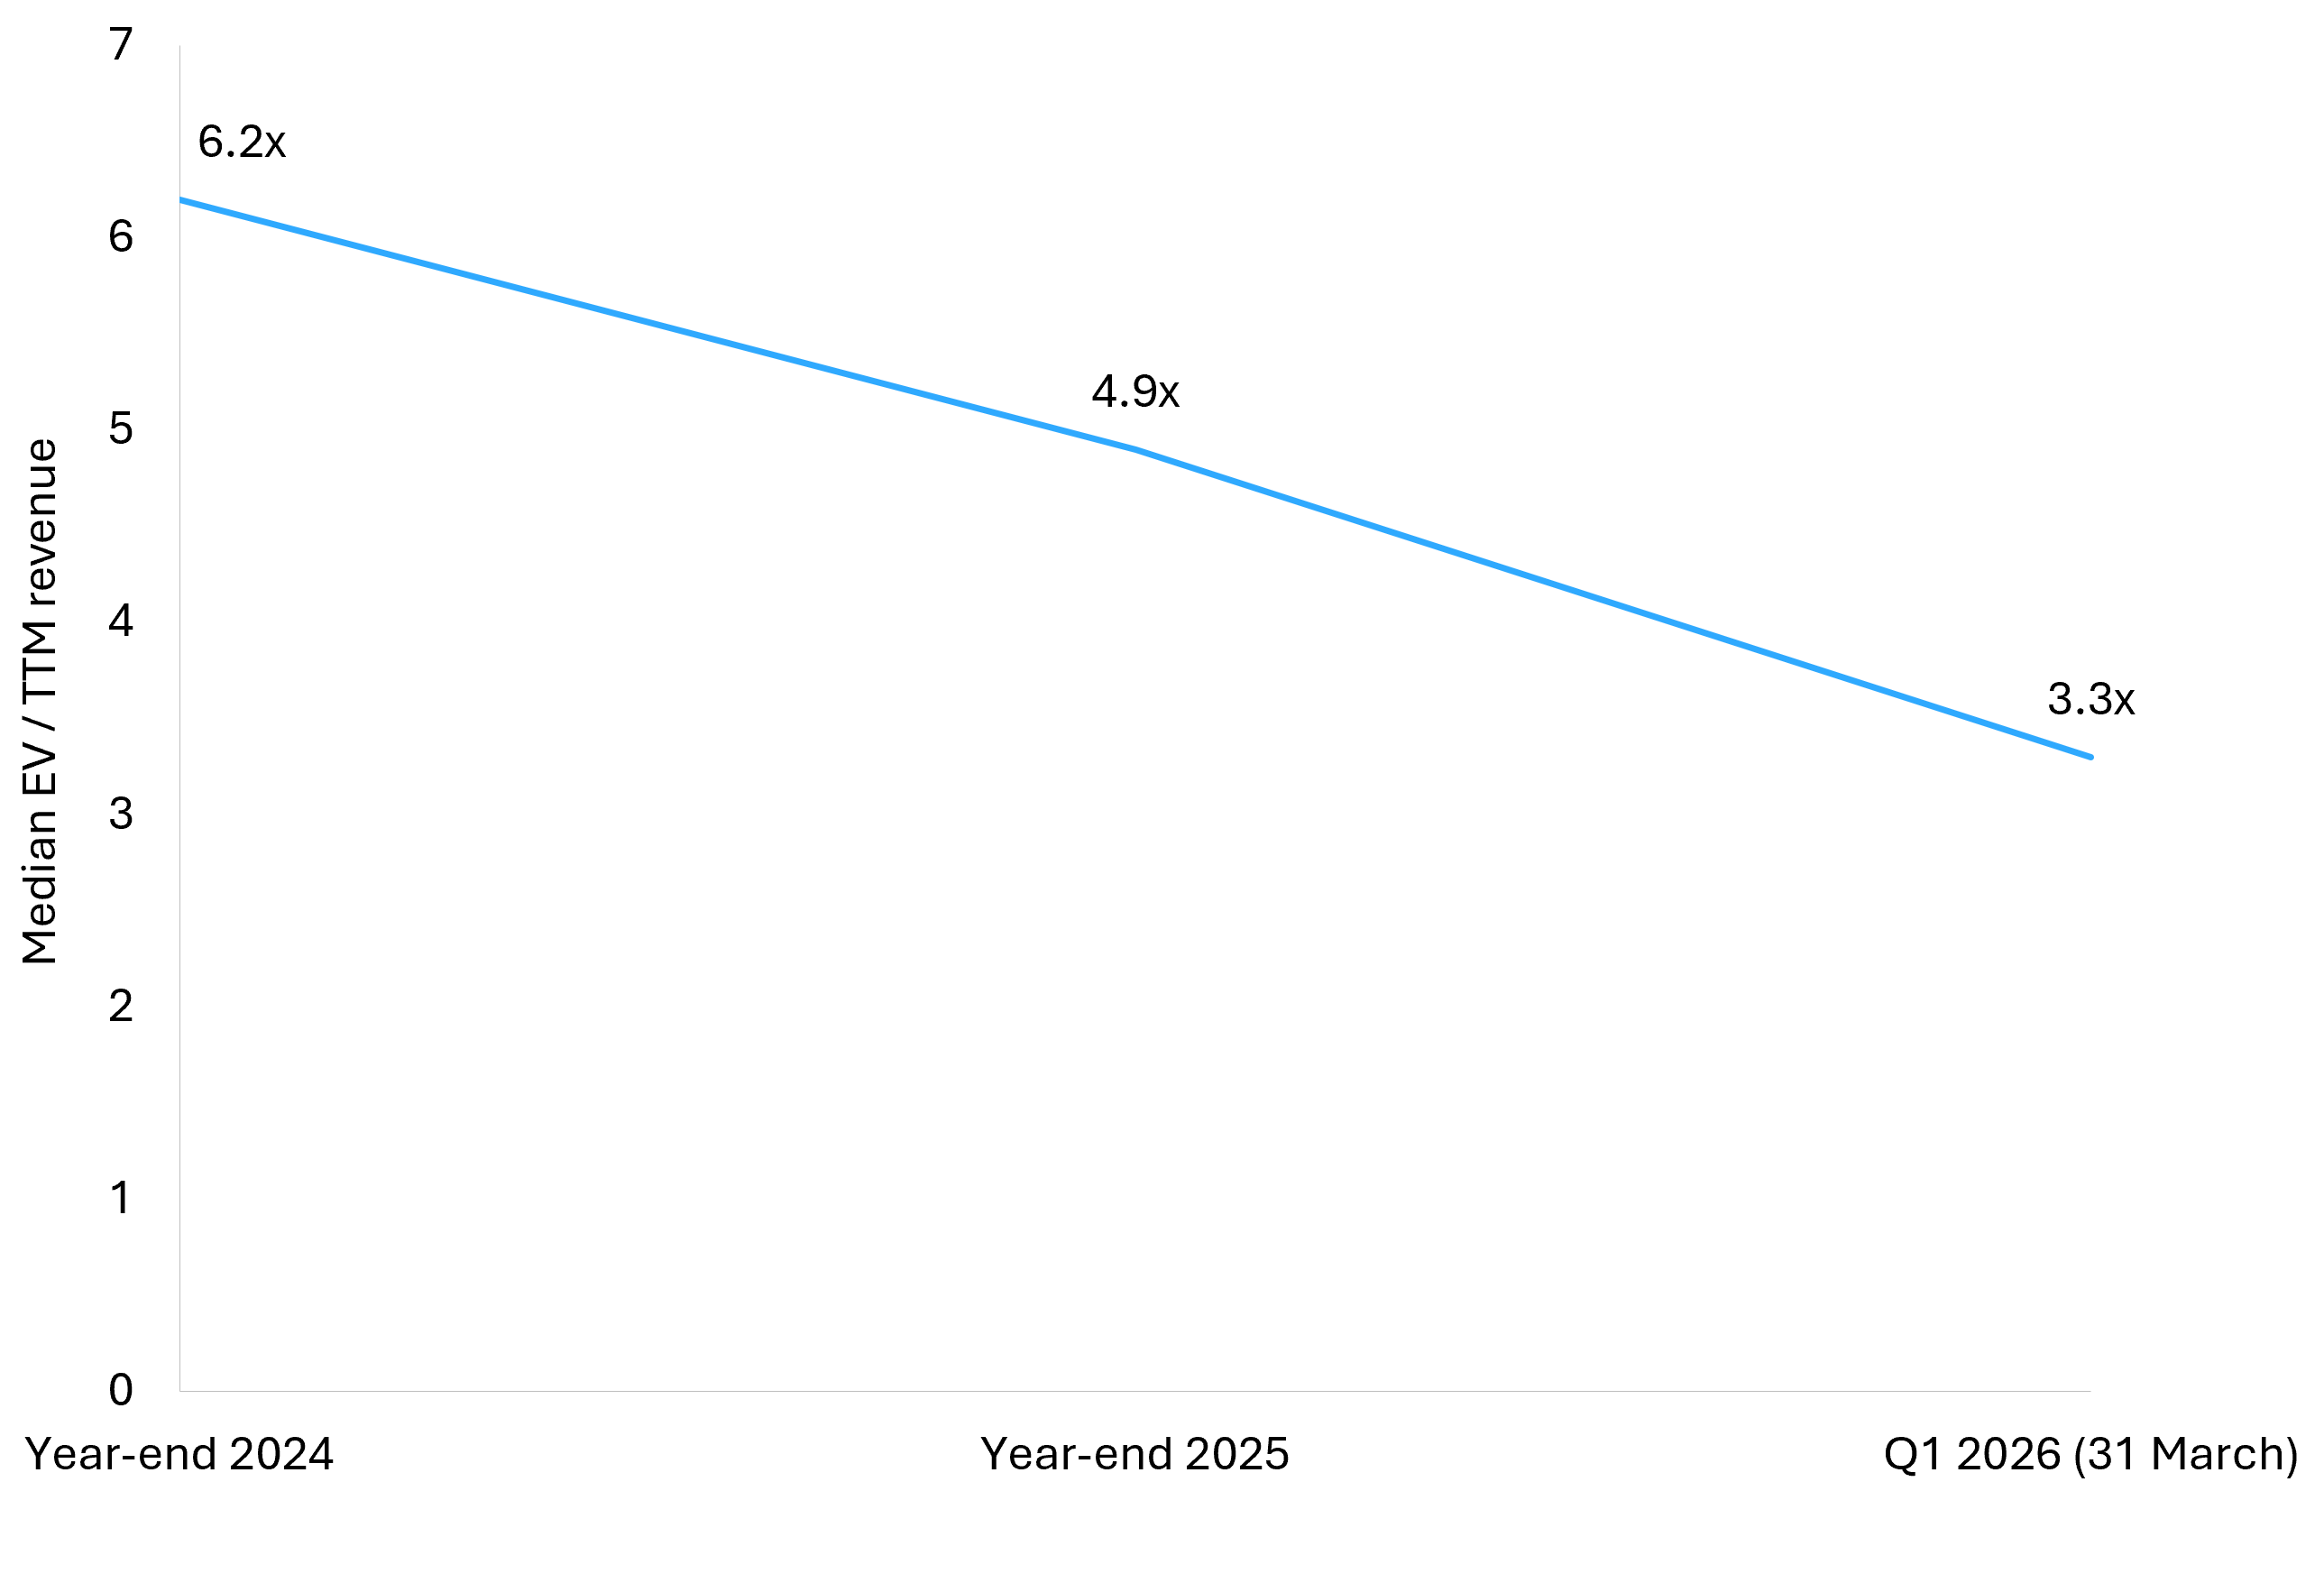
Here is what changed in 2026. Public software repriced quickly in the first quarter as investors worked through what agentic AI means for per-seat pricing models. The median enterprise value to trailing revenue multiple across 99 public enterprise SaaS companies tracked by PitchBook moved to 3.3x at the end of March, from 4.9x at year-end 2025 and 6.2x at year-end 2024. Underneath that reset, the operating story kept improving: median EBITDA margins are projected at 22.6% for 2026, up from 20.0% in 2025 and 17.4% in 2024.
For sellers, this is a more workable market than the headlines suggest. Benchmarks are clearer than they have been in years, buyers have real capital, and the premium for a well-prepared business has widened rather than narrowed. Global deal value climbed 41% year over year to $2.4 trillion in the first five months of 2026, putting the market on track for its second-highest year on record. The money did not leave. It became selective, which is exactly the condition under which preparation pays.
This guide covers what SaaS valuation multiples look like in 2026 across every ARR band from sub-$1M to $20M+, how growth, retention, gross margin, and the Rule of 40 move your number, why private and public multiples diverge, how bootstrapped and funded companies price differently, and which valuation basis a buyer will apply to a business your size.
What Are SaaS Valuation Multiples, and Why Does Software Command a Premium?
A SaaS valuation multiple is the number a buyer applies to one of your financial metrics to arrive at enterprise value. Three metrics dominate, and which one applies depends almost entirely on your size and profitability.
- ARR or revenue multiple. Enterprise value divided by annual recurring revenue, or by trailing twelve-month revenue. Used when a business is reinvesting heavily and current profit understates its earning power.
- EBITDA multiple. Enterprise value divided by earnings before interest, taxes, depreciation, and amortisation. The default for mature, profitable software companies, and the metric private equity underwrites against.
- SDE multiple. Seller discretionary earnings, which is net profit with the owner salary, benefits, and one-off or personal expenses added back. Standard for owner-operated businesses where a buyer is effectively replacing one person.
Software earns higher multiples than most business models for reasons a buyer can underwrite rather than believe in. Revenue recurs contractually instead of being re-won every month. Gross margins sit far above the wider market, with the median across public SaaS projected at 77.1% for 2026 in PitchBook's second-quarter comp sheet. Incremental revenue costs comparatively little to serve, so growth converts to profit at scale. And the underlying market keeps expanding: worldwide software spending is forecast to reach $1.44 trillion in 2026, growing 15.1% and making it one of the fastest-growing categories in all of IT.
This is also where SaaS separates from traditional licensed software. A perpetual-licence business books a large payment up front and then hopes for maintenance renewals, which makes forward revenue harder to predict and pushes buyers toward earnings-based pricing. A subscription business hands the buyer a contracted revenue base they can model out several years. That predictability is the premium. It is why a SaaS company and a licensed software company with the same revenue and the same profit rarely receive the same offer.
One clarification worth making early, because it causes more mispriced expectations than anything else. ARR is not revenue. ARR is the annualised value of your recurring contracts at a point in time. Trailing revenue is what you actually billed over the last twelve months. In a business growing 30% a year those two numbers can differ by 15% or more, and quoting the larger one to a buyer who is modelling the smaller one starts the conversation on the wrong footing.
Why the Average SaaS Multiple You Found Online Does Not Apply to You
Search for the average SaaS revenue multiple and you will get numbers between 3x and 12x, all published in 2026, all technically defensible. They disagree because they are measuring different things, and the gap between them is the single most common reason founders walk into a process with the wrong price in their head.
Take the US software sector as academic datasets record it. Across the 309 listed system and application software companies in NYU Stern's January 2026 dataset, enterprise value works out to 11.4 times revenue, and 24.5 times EBITDA for the companies with positive EBITDA. Those figures are correct. They are also aggregates, which means the sector total is divided by the sector total. A handful of trillion-dollar constituents carry most of the weight, so the number describes Microsoft far better than it describes any private company.
Now take the median for the same broad universe. PitchBook's figure was 3.3x trailing revenue at the end of Q1 2026. Same sector, same moment, roughly a quarter of the number, because the median describes the typical company rather than the aggregate of a size-skewed group.
The practical rule is simple. Averages tell you about the biggest companies in a dataset. Medians tell you about the middle. As a seller you are being priced against the middle, adjusted for your own facts, so the median is the number to anchor on and the average is the number to ignore.
There is a second distortion worth knowing about. Multiples quoted from venture rounds are not exit multiples. A funding round prices a minority stake with liquidation preferences, pro-rata rights, and information rights attached, in exchange for growth optionality. An acquisition prices 100% of the business, in cash, with the buyer assuming full execution risk from day one. The same company can carry a 12x round multiple and a 5x exit multiple simultaneously, and both are real.
Quotable takeaway: the sector average is a description of the largest listed companies in a dataset. The median, adjusted for your growth and retention, is a description of your business.
What Is the Real Gap Between Public and Private SaaS Multiples?
Private SaaS multiples do not track public ones in real time, and 2026 produced unusually clean evidence of exactly how much slower they move.
Through 31 March 2026, software valuations held inside private equity portfolios declined by roughly 8% overall, far less than the corresponding public market move, with the split running 8.9% in the US and 4.2% in Europe. Bain published these figures in its 2026 Private Equity Midyear Report, drawing on MSCI analysis of first-quarter buyout marks. Set that against the public median moving from 4.9x to 3.3x over the same quarter, a decline of roughly 33%, and the divergence is stark.
Three mechanics explain it, and each one matters to a seller.
Private prices are negotiated, not quoted. A public multiple is the output of continuous trading, so it reprices in hours. A private multiple is the output of a process involving diligence, a data room, and a negotiation, which typically runs three to nine months. Deals signing today were priced against a market view formed months ago.
Private buyers underwrite cash flows, not sentiment. A strategic acquirer buying a workflow-critical product is modelling synergies and integration over five years. That model barely moves when a public index reprices in a quarter.
Private assets are held, not traded. A sponsor with no reason to sell simply does not sell, so weaker prints never enter the dataset. That same dynamic explains why roughly 75% of buyout assets still exit above their next-to-last quarterly mark, a pattern that has held through several cycles.
The lag cuts both ways, and it is worth being straight about that. When public multiples expand, private sellers do not capture the increase immediately either. What the lag does provide is stability. Private buyers in 2026 are pricing off fundamentals rather than off a quote screen, which rewards businesses that can evidence quality with clean numbers.
Public markets also matter less to a private seller than most founders assume, because the buyer pool is different. The initial public offering route effectively closed to venture-backed software during the first quarter of 2026 as issuance paused, which pushed more late-stage companies toward acquisition exits and added competition on the buy side of private processes. For a founder selling a $5M ARR business, that is a tailwind, not a headwind.

SaaS Valuation Multiples by ARR Band: Sub-$1M to $20M+
Scale changes the multiple more than almost any other single factor, and it does not change it smoothly. Multiples step up at thresholds, because each threshold opens a new pool of buyers with a different cost of capital and a different reason to buy.
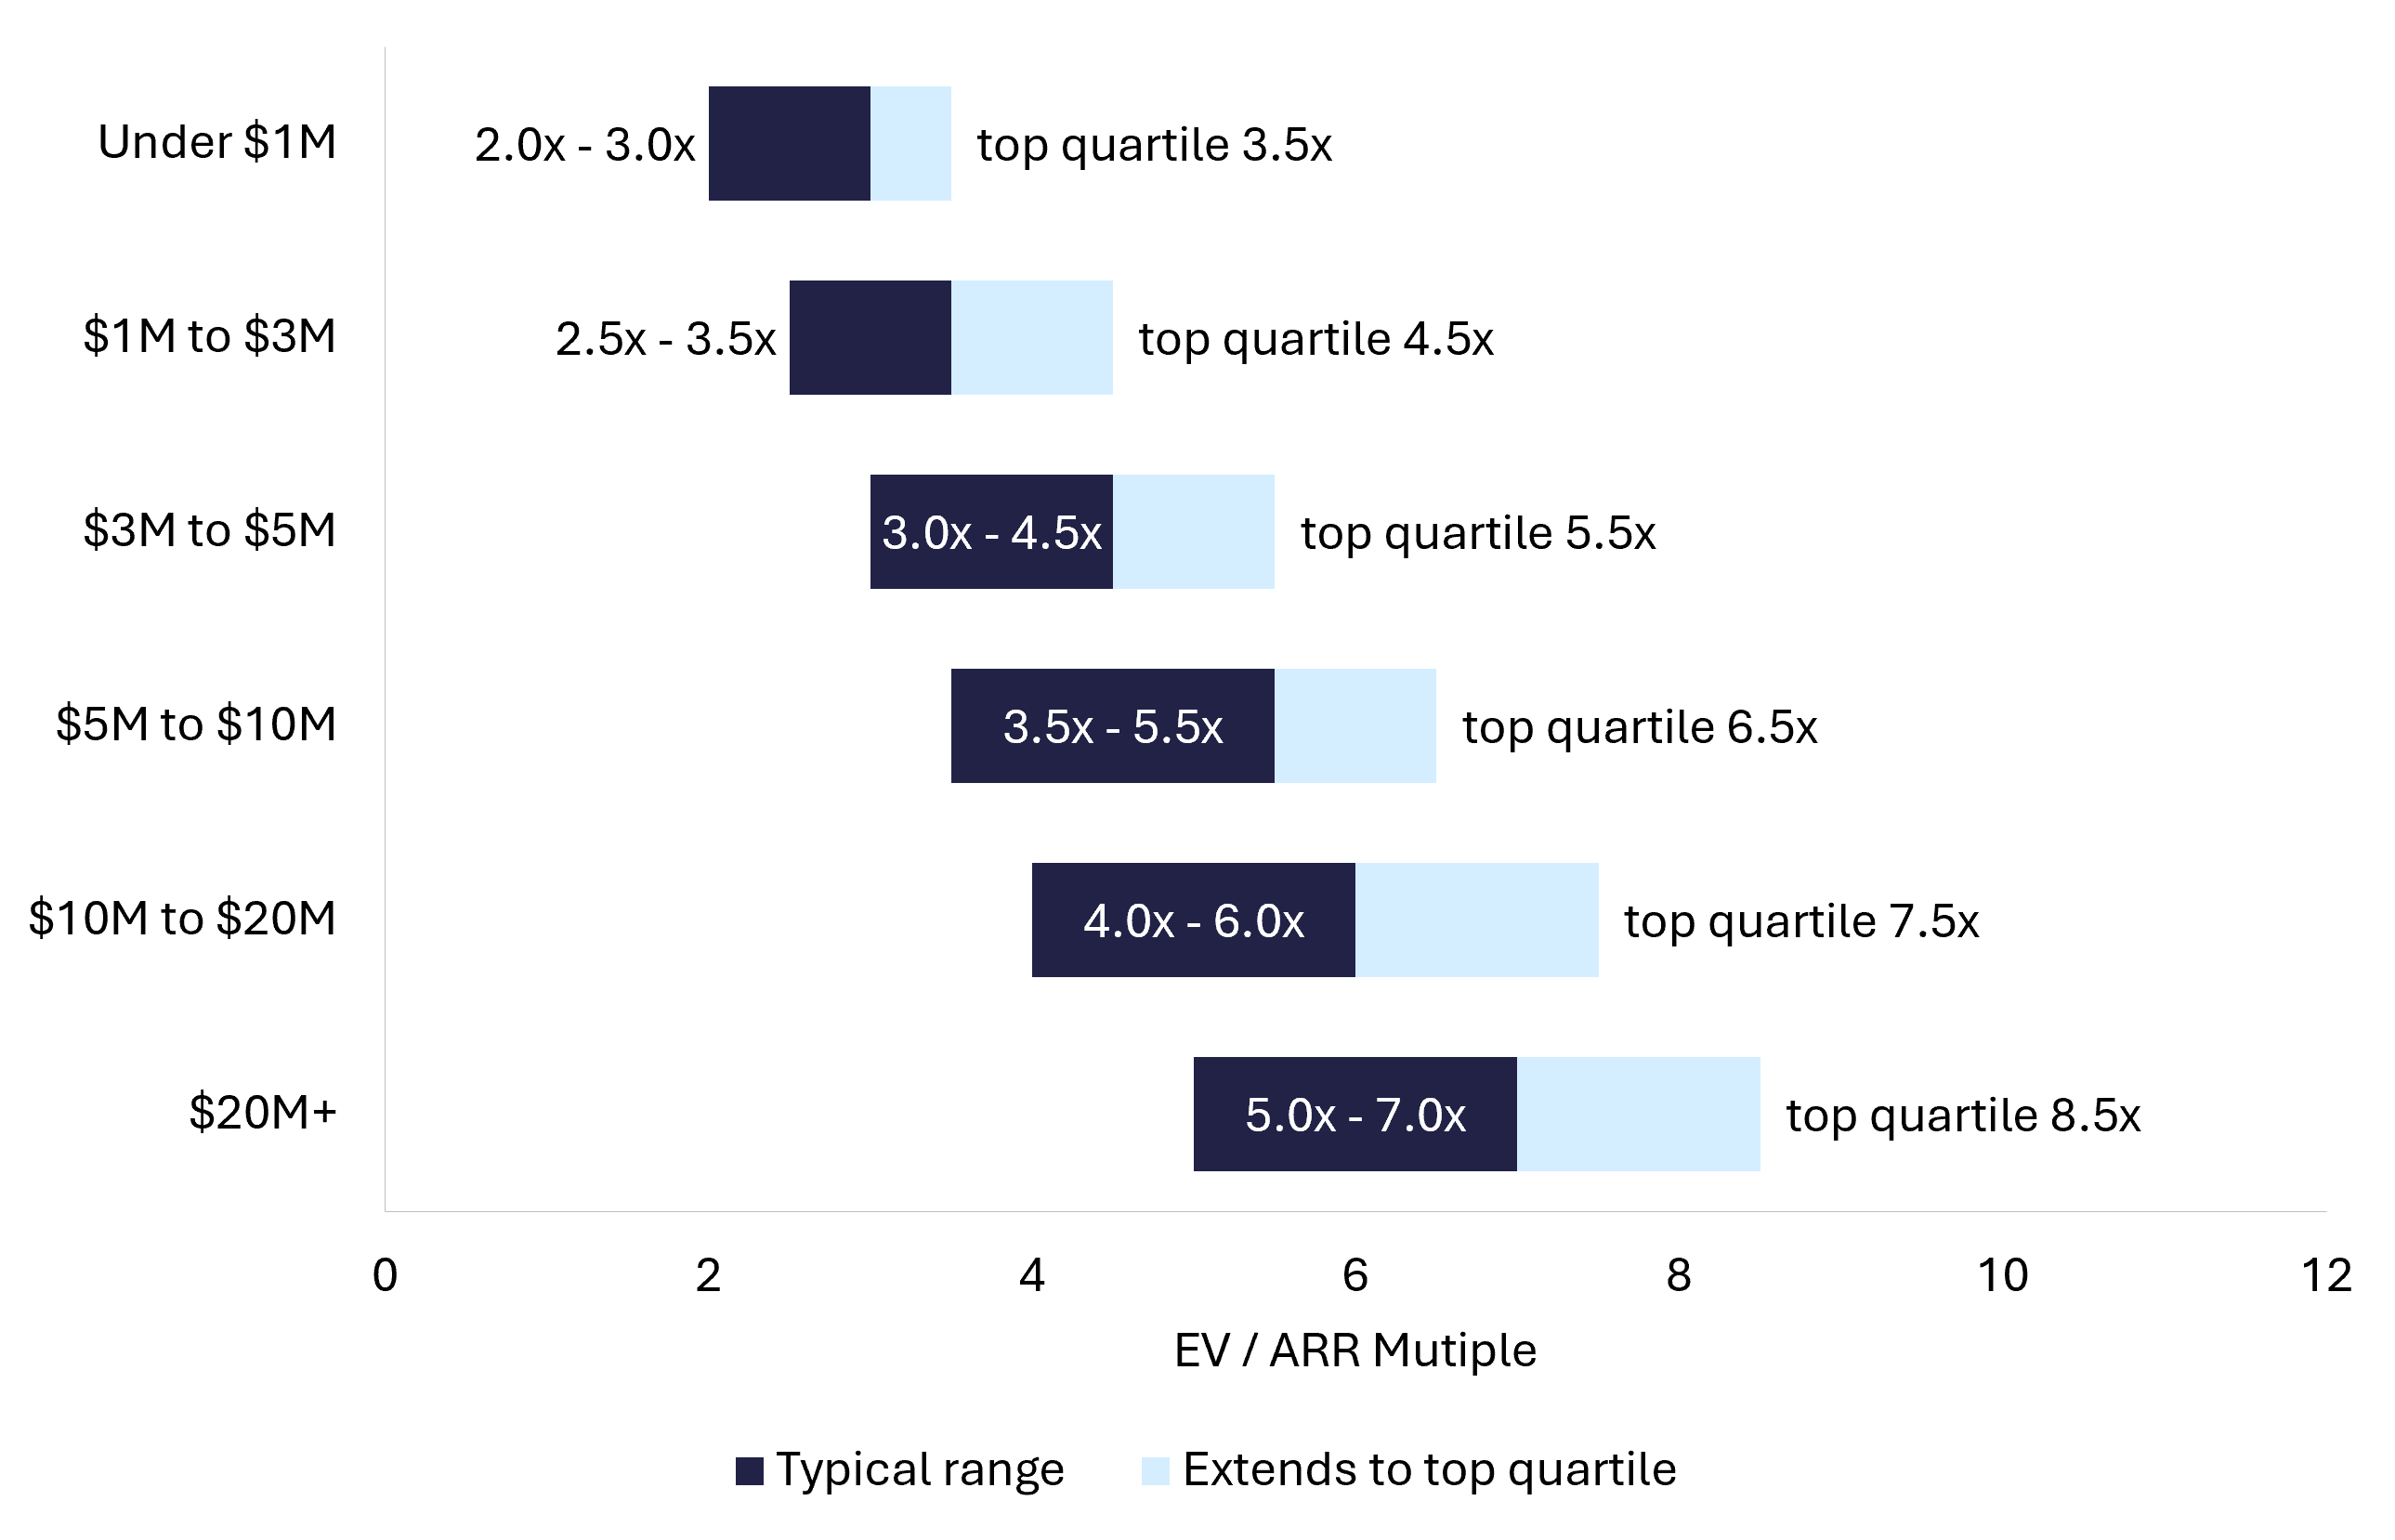
The table below reflects private transaction ranges FE International observes across its advisory work, cross-checked against the public benchmark. FE has advised on more than 1,500 completed transactions since 2010 with a 94.1% success rate, across SaaS, ecommerce, fintech, cybersecurity, edtech, AI, agencies, and marketplace apps. The top-quartile column assumes a business clearing the Rule of 40 with net revenue retention above 110% and low customer concentration.
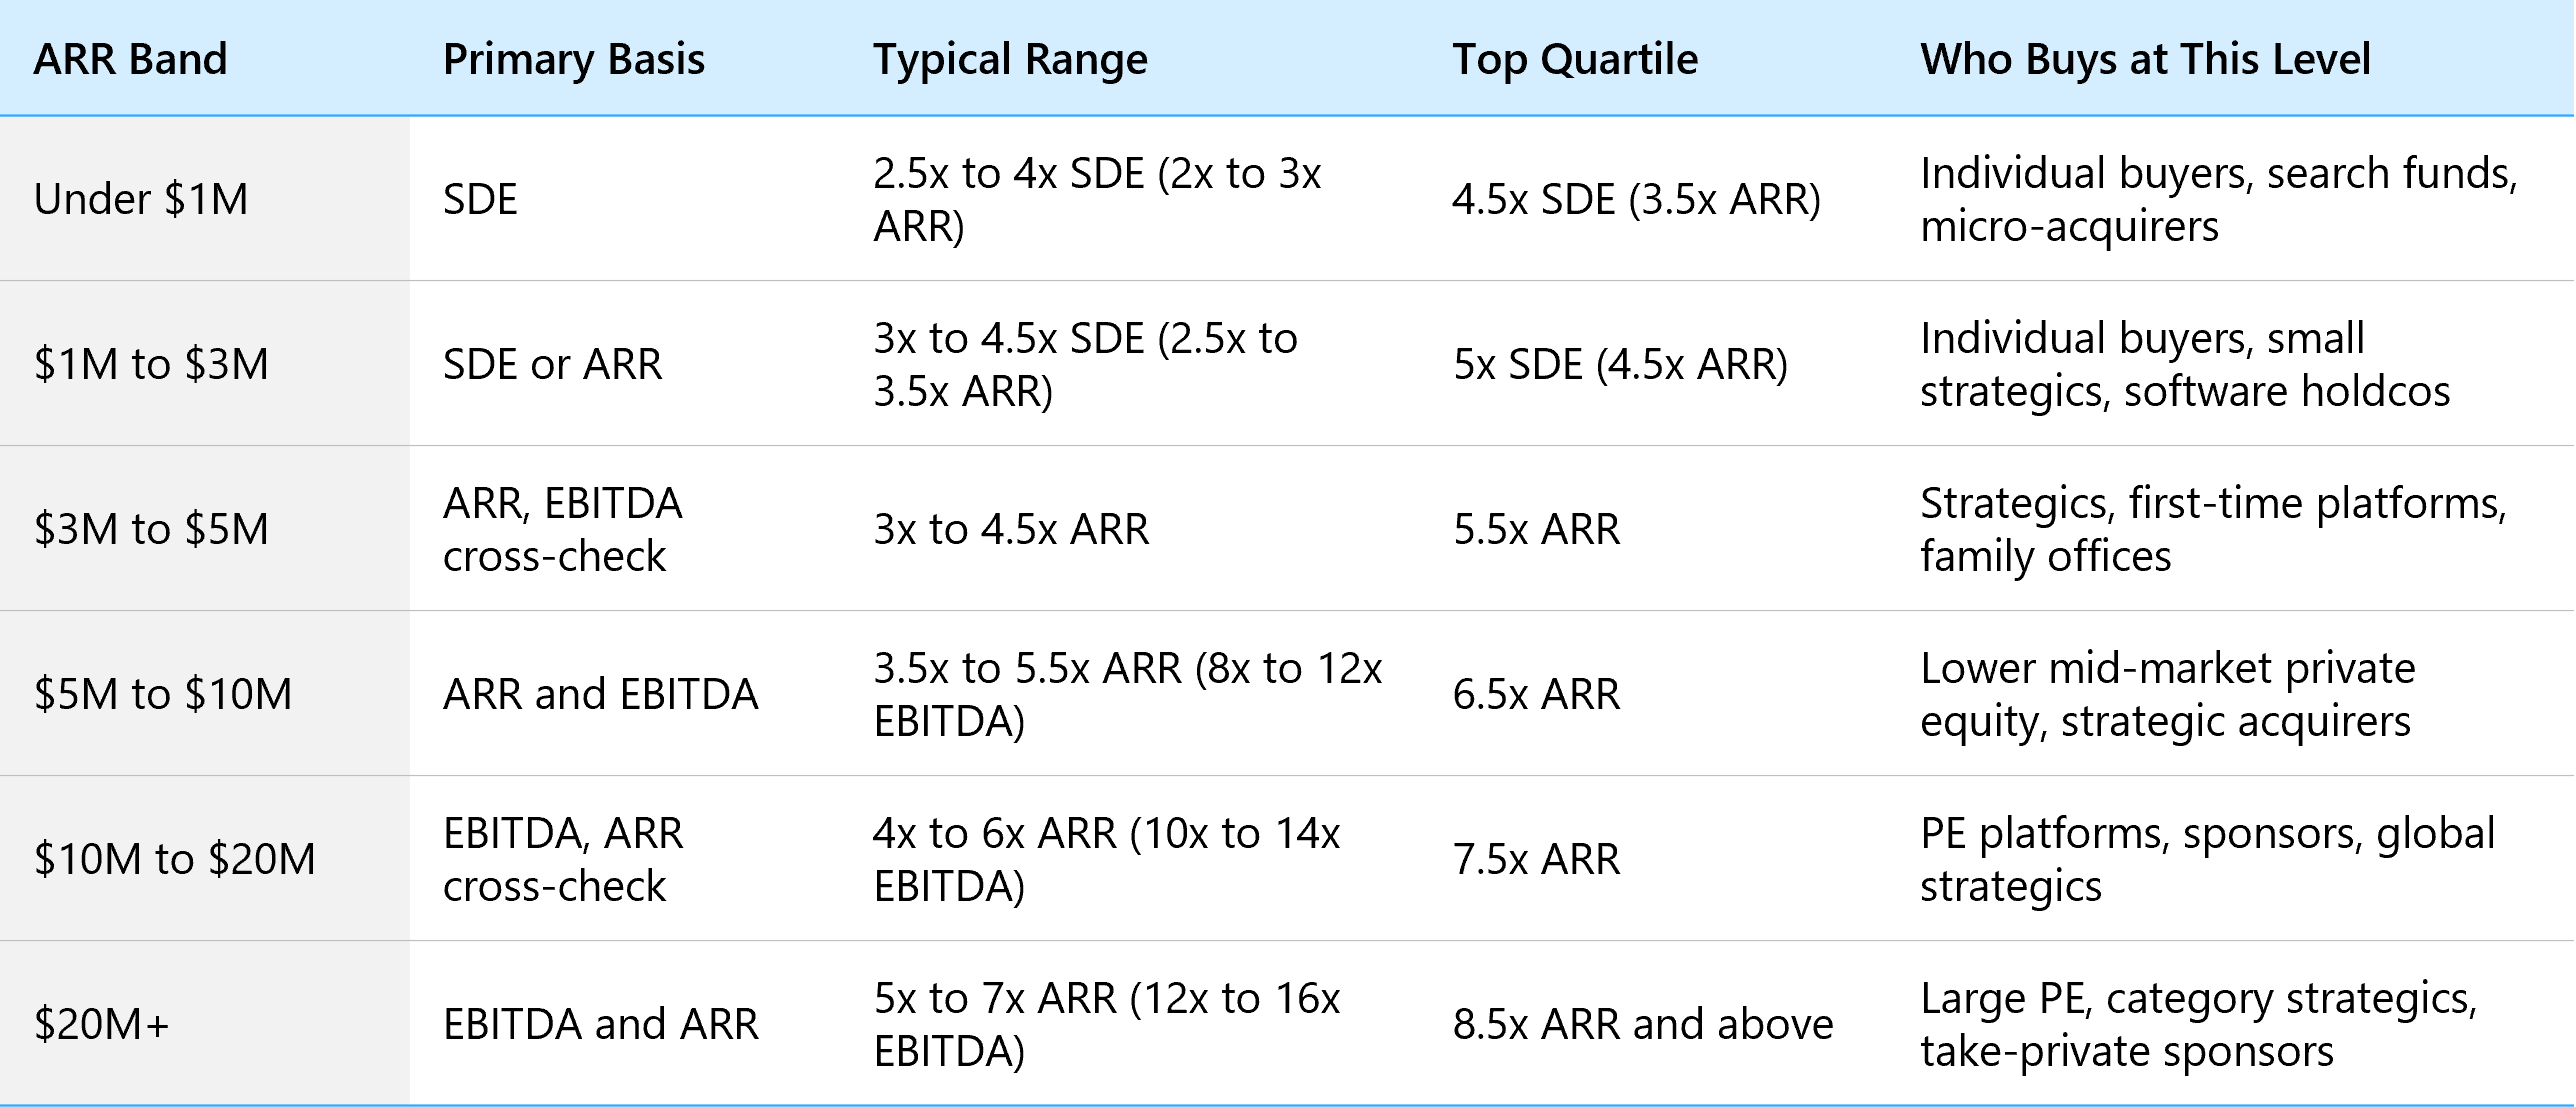
Ranges reflect FE International advisory data across 1,500+ transactions, cross-checked against public benchmarks. Individual outcomes depend on the drivers set out in the next section.
The steps are worth reading carefully, because founders consistently underestimate what crossing one is worth.
Below about $1M ARR, a buyer is largely purchasing a job. Owner dependency is high, the buyer pool is individuals rather than institutions, and pricing runs off SDE because what matters is the cash one operator can extract. Multiples here are modest, but so is the preparation burden.
Between $3M and $5M, something changes. The business can usually support a small team, the founder is no longer the only person who understands the product, and institutional buyers start to look. Revenue-based pricing becomes standard. This is the threshold where a year of deliberate preparation produces the highest return on effort.
Above $10M ARR, private equity platforms enter properly and the competitive dynamic shifts in the seller's favour. Sponsors are sitting on substantial dry powder with real pressure to deploy it. Bain notes the industry is holding roughly 33,000 unsold portfolio companies with implied holding periods running to around seven years, which is precisely the condition that makes sponsors motivated buyers of quality assets and motivated sellers of mature ones.
There is a related segmentation that runs underneath the ARR bands: who your customers are. Businesses selling into enterprise accounts with contract values above $100,000 support materially higher retention than businesses selling to small companies, and retention is priced. A $5M ARR enterprise-focused product and a $5M ARR SMB-focused product are not the same asset, and buyers will not price them the same way.
Which Metrics Actually Move the Multiple?
Scale sets your band. Four metrics decide where inside that band you land, and the spread they create is larger than the spread between bands.
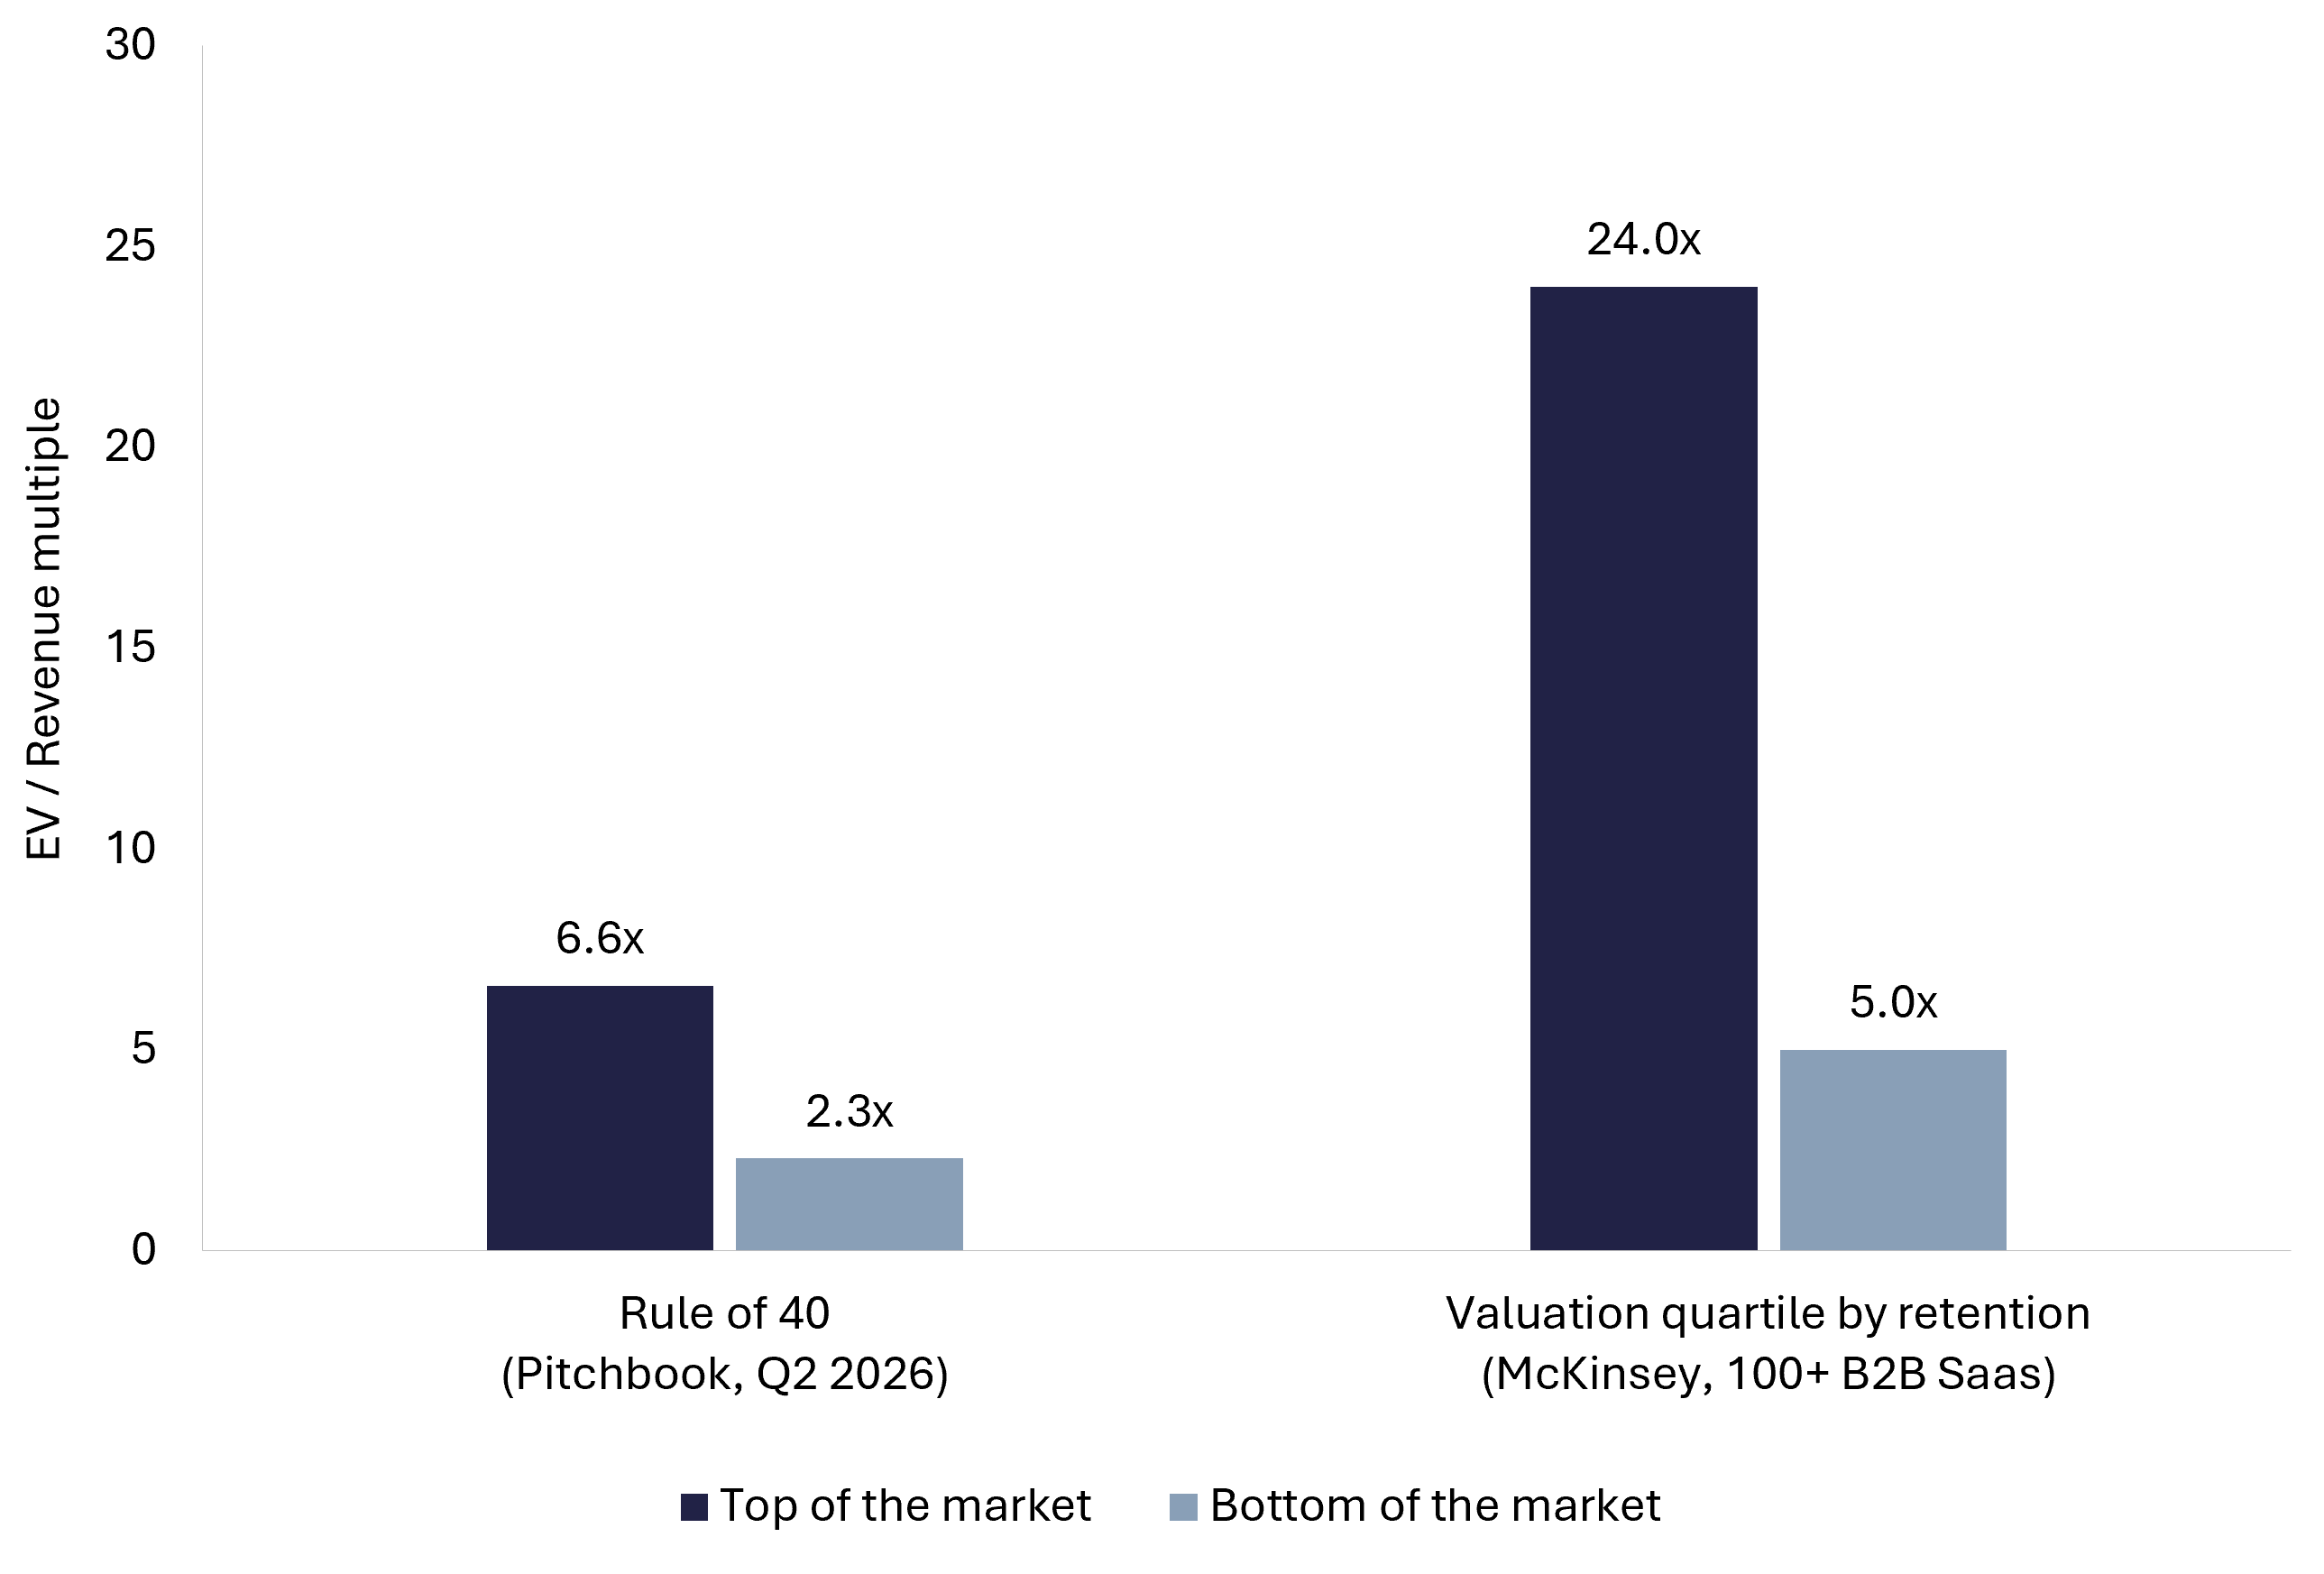
Retention is the heaviest of the four. McKinsey's work across more than 100 B2B SaaS companies found that companies in the top quartile of valuation multiples traded at a median 24 times revenue against 5 times for the bottom quartile, measured from the first quarter of 2019 through the fourth quarter of 2024, with net revenue retention the metric most closely associated with the difference. A five-fold valuation gap traced primarily to one number.
The mechanism is compounding, not sentiment. A business at 120% net revenue retention grows its existing customer base by 20% a year without signing a single new logo. A business at 95% has to sell 5% of its revenue just to stand still. Over a five-year model, those two businesses produce completely different cash flows from the same starting ARR, and a buyer paying a multiple of ARR is buying that stream. Our guide to net revenue retention and SaaS valuation works through the arithmetic in detail.
The Rule of 40 runs a close second, and 2026 gave us the cleanest read on it yet. Public SaaS companies meeting or exceeding the benchmark trade at a median 6.6x trailing revenue, against 2.3x for companies below it. Nearly a three-fold difference, on a threshold that most management teams can move deliberately over 12 to 18 months.
Gross margin functions as a gate rather than a slider. Above roughly 75% a business is treated as software. Below 70% buyers start asking which part of the revenue is really services, and they price that part differently. Median gross margin across public SaaS is projected at 77.1% for 2026, so that is the bar you are being measured against. If your business blends software and services, separating the two cleanly in your financials is one of the cheapest valuation improvements available to you.
Growth still matters, but its weighting has shifted. Median revenue growth across public enterprise SaaS is running around 13.2% for 2026 while median EBITDA margins expand toward 23.3%. In a market where the typical company grows in the low teens, growth above 30% is genuinely differentiating, and growth funded by burn is worth considerably less than the same growth funded by operations.
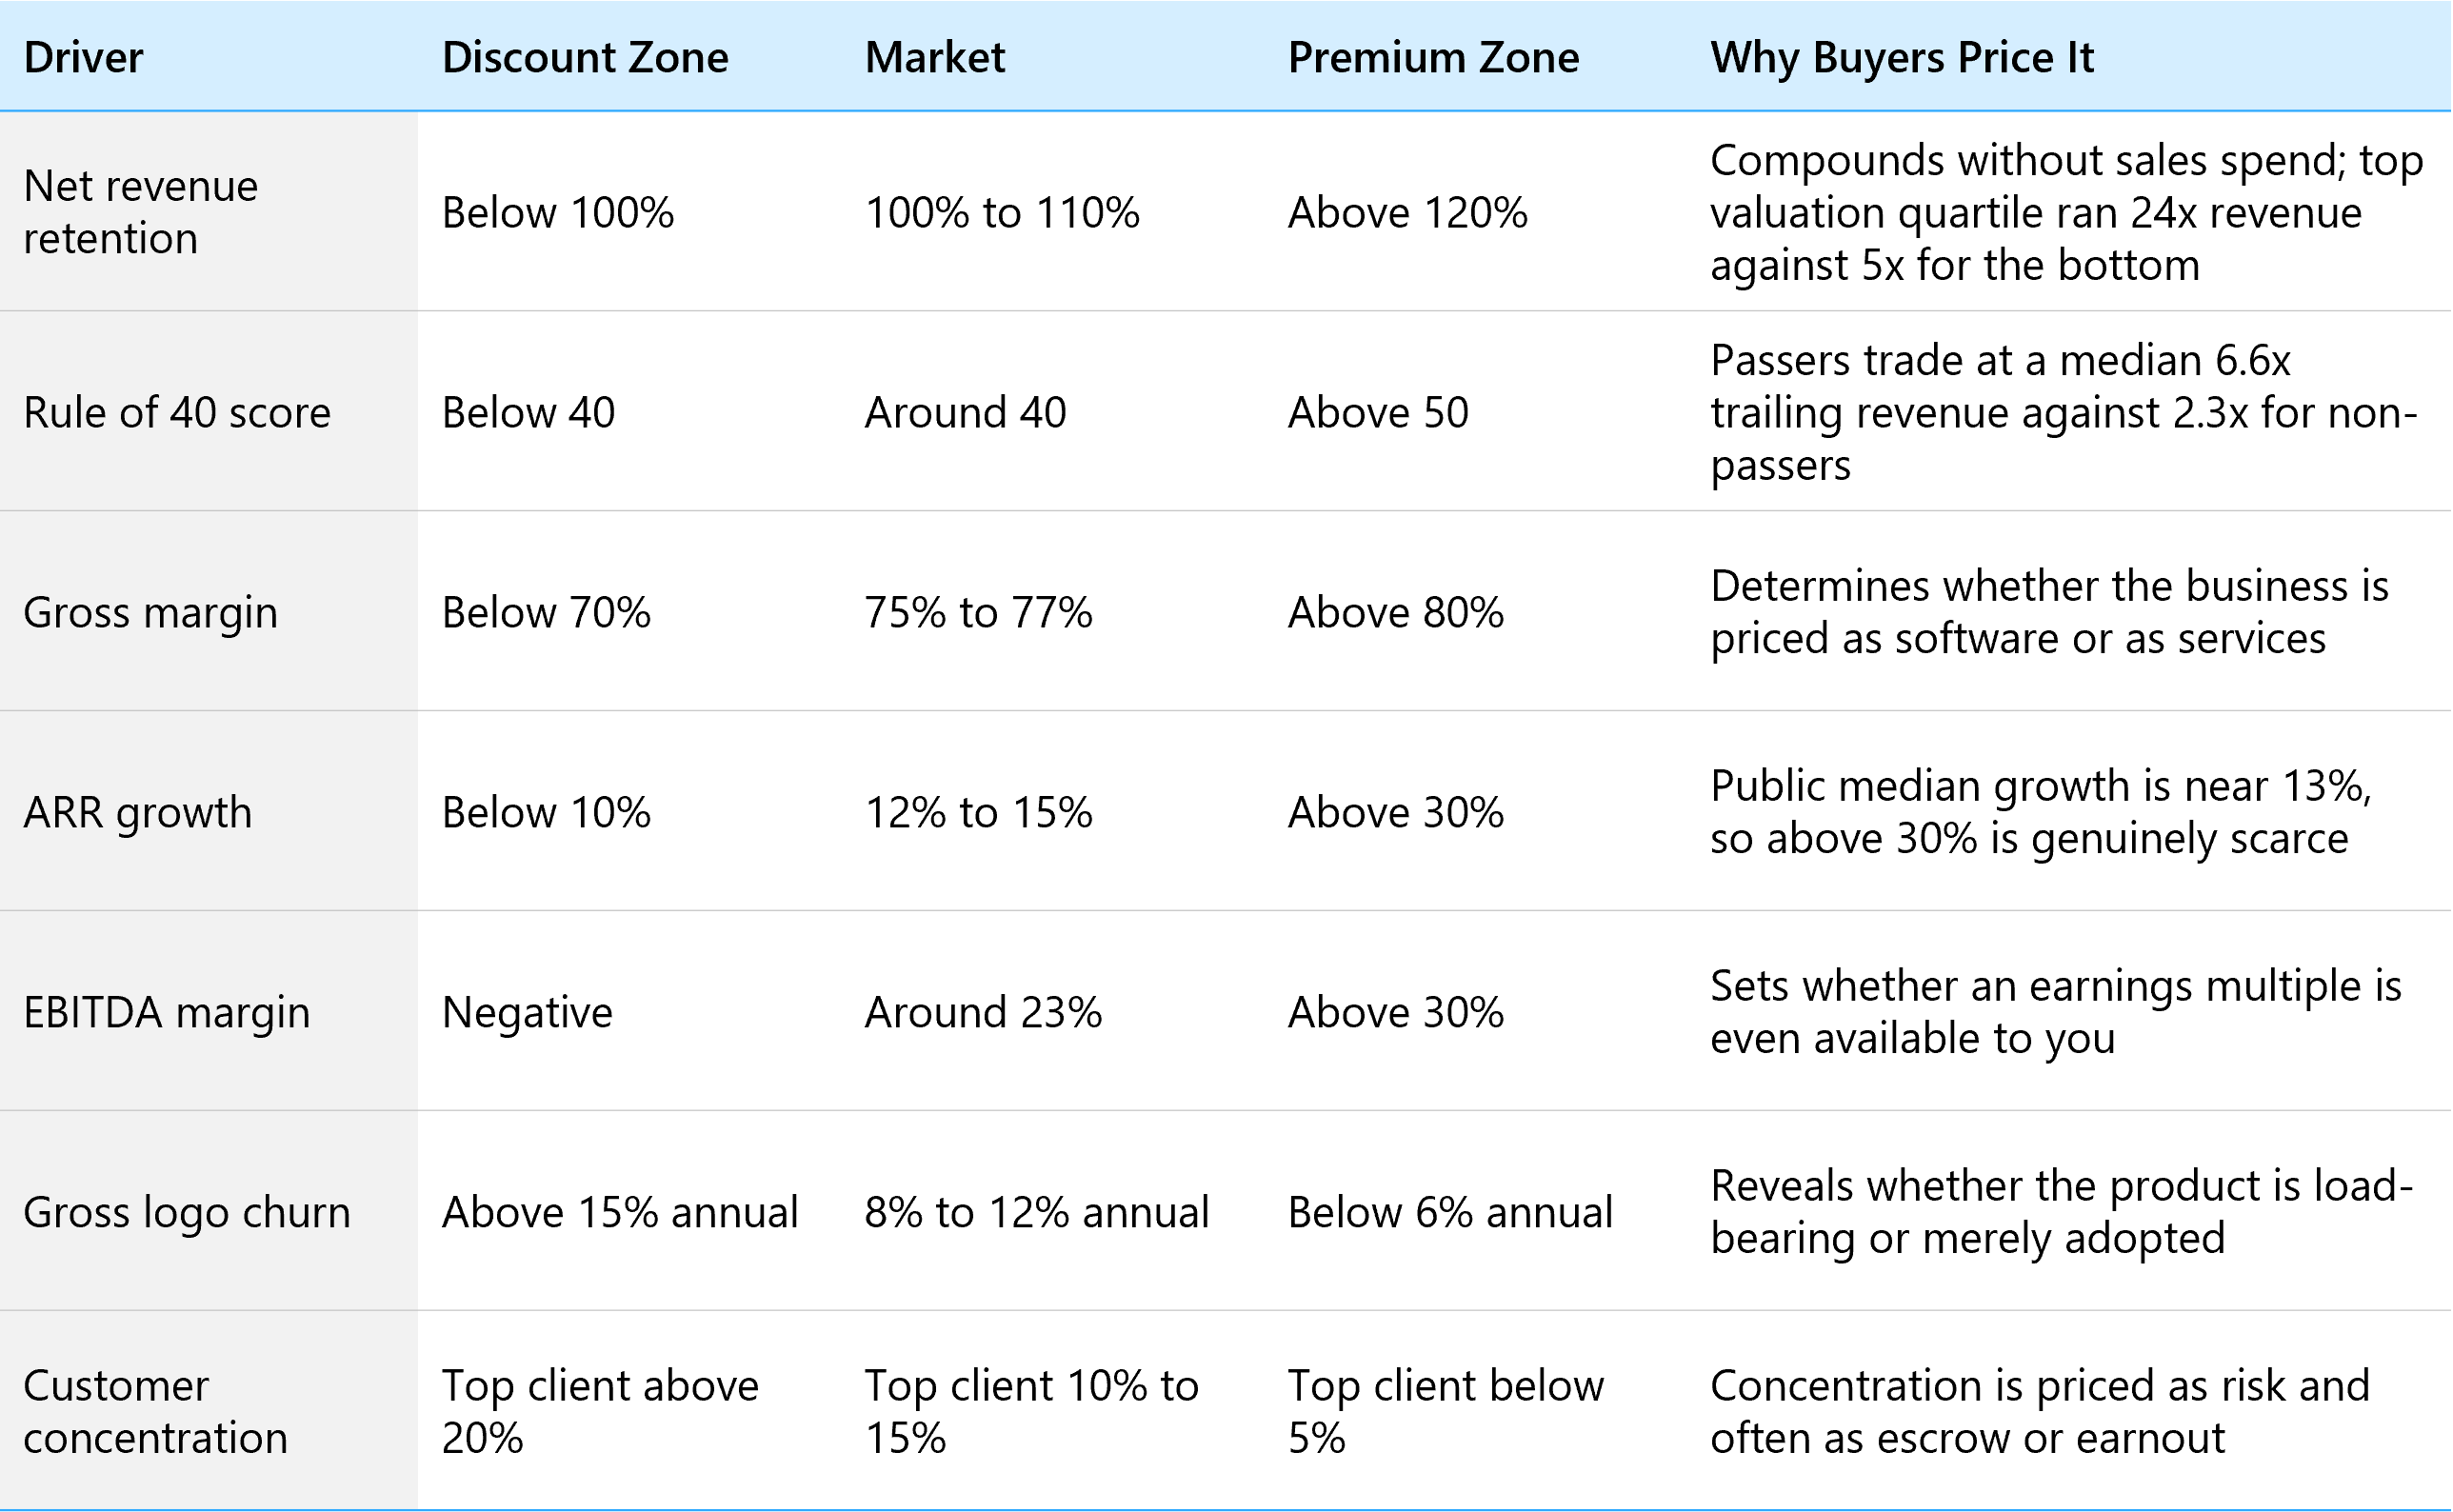
Retention and Rule of 40 figures from McKinsey and PitchBook research cited above. Churn and concentration ranges reflect FE International transaction experience.
Churn deserves a specific warning because it degrades quietly. A business can post 40% growth while losing a third of its logos annually, since new sales mask the leak. Acquirers isolate retention first for exactly this reason, and the businesses that hold their multiple through diligence are the ones that present churn cohort by cohort before anyone asks. Our SaaS churn rate benchmarks set out what buyers expect to see at each customer size.
Is the Rule of 40 Still the Right Bar in 2026?
The Rule of 40 says growth rate plus profit margin should exceed 40%. A company growing 25% with a 20% EBITDA margin scores 45 and passes. It has been the industry's efficiency test for a decade, and the PitchBook spread above confirms the market still prices it heavily.
What 2026 added is a genuine complication that most valuation guides have not caught up with. Bain's software practice argues that AI is making the 40 threshold harder to clear for reasons that have nothing to do with company quality, and that some companies may need to accept a Rule of 30 for a period while they reinvest.
The cost side is the reason. Software has always run on low marginal costs. Paying for AI inference, infrastructure, and model access introduces real variable cost into a business model that previously had almost none, and that cost scales with usage. Bain cites a high-growth marketing technology company whose revenue rose 38% between the third quarter of 2024 and the third quarter of 2025 while its costs rose 349%, driven partly by new AI infrastructure and hosting. Costs grew nearly nine times as fast as revenue.
So how should a seller read this? Carefully, and with the emphasis on evidence.
If your Rule of 40 score sits below the threshold because you are funding a deliberate AI investment programme with a measurable return, that is a defensible position and increasingly a recognised one. Bain notes that companies which have genuinely transformed their operations with AI are achieving 10% to 25% increases in EBITDA. A buyer will fund a gap they can see the other side of.
If your score sits below the threshold because growth slowed and costs did not, that is a different conversation and buyers can tell the difference in about twenty minutes of diligence. The distinction is documentation. Show the investment, show the cohort or margin evidence that it is working, and show when the score recovers.
Bain frames the underlying decision as a fork: financialise the business, limiting AI investment and running it as a durable cash generator, or invest to grow, accepting short-term margin pressure to reemerge with stronger differentiation. Both paths can produce a strong exit. They produce different buyers, though. The first attracts sponsors and cash-flow buyers who will pay a solid earnings multiple. The second attracts strategics who will pay for capability and are far less sensitive to this year's margin.
Quotable takeaway: in 2026 buyers are not just checking whether you clear the Rule of 40. They are checking whether they can see why you do not.
Do Bootstrapped and Funded SaaS Companies Trade Differently?
They do, though the gap is narrower than most founders on either side expect, and it runs in a direction that surprises people.
Venture-backed companies typically carry a modest premium on headline multiple. They tend to grow faster, they usually have management depth beyond the founder, their reporting is already investor-grade, and their boards are experienced at running processes. Each of those reduces perceived risk, and reduced risk shows up in price.
Bootstrapped companies carry three advantages that frequently close the gap and sometimes reverse it. The cap table is clean, so there is no preference stack to work through and no investor with a veto over a price the founder is happy with. Capital efficiency is usually structurally better, which reads directly into the Rule of 40. And the decision to sell belongs to one or two people, which shortens processes and makes deliverability credible to a buyer weighing two similar assets.
That last point is underrated. A buyer choosing between two comparable businesses will pay more for the one they are confident will actually close.
The preference stack is where funded founders should focus, because it changes what a headline multiple means to you personally. If a business raised $12M across several rounds with a 1x non-participating preference and sells for $30M, the preference is satisfied first and common equity divides what remains. Two founders can announce identical multiples and take home amounts that differ by an order of magnitude. Model your own waterfall before you anchor on any published benchmark.
One genuine exception has opened up in 2026, and it is concentrated in AI. Late-stage AI companies are being valued far above their peers in venture markets, with Series D and later AI companies trading at 6.6 times the valuations of their non-AI peers during the first half of 2026, while megadeals absorbed 87.5% of every dollar deployed. If you are a funded AI-native business, your relevant comparison set is that cohort rather than the general SaaS market. For everyone else, the venture premium is real but measured in tenths of a turn, not multiples.
A practical note for bootstrapped sellers under $5M ARR: your biggest lever is not growth, it is transferability. Documented processes, a team that can run the product without you, and financials that reconcile to a bank statement will move your multiple further than another five points of growth, because they attack the exact risk your buyer is pricing.
How Is the 2026 AI Re-Rating Splitting the SaaS Market?
The defining valuation story of 2026 is that buyers stopped pricing software as one category. Public investors repriced quickly in the first quarter as agentic AI tools capable of executing multi-step workflows reached the market, and the question they were repricing was whether per-seat pricing holds when an agent can do the work of several seats.
That question does not have one answer, which is why the market split rather than fell uniformly. PwC frames the split usefully for sellers, noting that buyers are reassessing which platforms are AI-native, AI-resilient, or AI-exposed. Those three categories are worth applying to your own business honestly, because a buyer will apply them within the first hour of a management meeting.
AI-native
AI is the product, and the product does something that was not previously possible. This cohort commands the strongest pricing in the market by a wide margin. It is also small, and buyers have become sharp at distinguishing a genuine AI product from a conventional product with a model wrapped around it.
AI-resilient
The product owns a workflow, a system of record, or a proprietary dataset that an agent cannot simply replicate. Most healthy vertical SaaS sits here, and it is where 2026 buyers have concentrated their capital. Recent transactions including IBM's $11 billion acquisition of Confluent suggest buyers are prioritising platforms with embedded workflows, proprietary data, and high switching costs precisely because those attributes become more valuable in an AI-enabled operating environment, not less.
AI-exposed
The product performs a task an agent could plausibly absorb, with thin data and shallow workflow integration. Multiples here have compressed, and the honest advice is that positioning will not fix it. Retention evidence might. If your churn held steady through 2026 while agentic tools became widely available, that is the most persuasive data you own, and it is worth presenting early rather than defending late.
Bain adds a point that should reassure incumbents. Existing customer relationships, embedded workflows, and systems of record may give established software companies an advantage over AI-native point solutions, because distribution and data are harder to build than a model is to access. Being the incumbent in a defined workflow is an asset in this market rather than a liability.
The top of the market shows what buyers will pay when a business is genuinely category-defining. Google closed its $32 billion acquisition of Wiz in March 2026, the largest deal in its history, for a cloud security business that had crossed $1 billion in annual recurring revenue. Palo Alto Networks completed its CyberArk acquisition in February and ServiceNow closed its $7.75 billion purchase of Armis in April. We cover the pattern behind these in our analysis of 2026 cybersecurity M&A.
Those are not comparable transactions for a $5M ARR business, and nobody should pretend otherwise. What they demonstrate is buyer conviction. Acquirers are writing very large cheques for defensible positions in AI-adjacent categories, and that conviction flows down into the middle market through carve-outs, portfolio reviews, and platform building.
There is a directly useful consequence for sellers, and PwC states it plainly: compressed valuations are beginning to drive renewed interest in software M&A and take-private opportunities for selected assets. Buyers who found software expensive in 2024 are engaging again. A market where buyers see attractive entry points is a market with more bidders in it, and more bidders is what actually sets your price.
ARR, EBITDA, or SDE: Which Basis Will a Buyer Apply to Your Business?
Founders often ask which valuation method is correct. The better question is which one your buyer will use, because that decision is made by the buyer based on your size and profitability, not chosen by the seller.
The broad convention across the middle market runs like this. Businesses valued under roughly $5M are priced on a multiple of SDE, because the buyer is stepping into an owner-operator role and wants to know what cash the business puts in one person's pocket. Above that, EBITDA becomes the primary metric, because the business supports a management team and the buyer is acquiring an asset rather than a job. Revenue multiples are applied when a company is reinvesting so heavily that current earnings understate what the business will produce. Our guide to valuing a SaaS business works through each method with examples.
The gap between SDE and EBITDA catches people out. SDE adds back a full owner salary; EBITDA does not, because a buyer at that size must hire someone to do the job. A business with $600,000 of SDE where the owner draws $150,000 has roughly $450,000 of EBITDA. Same business, same cash, two numbers that differ by a third. Applying an EBITDA multiple to an SDE figure is one of the most common valuation errors we see, and it always overstates the answer.
It is also worth understanding why a private EBITDA multiple sits well below the public one. The aggregate for listed US system and application software companies is 24.5 times EBITDA. Private lower middle market software transactions generally clear in the low-to-mid teens, and the wider M&A market held at a median 10.2 times trailing EBITDA in the second quarter of 2026 across all sectors. The difference is not a discount for being private in some abstract sense. It reflects illiquidity, smaller scale, key-person risk, thinner management, and the reality that a private buyer cannot exit a position by selling shares on a Tuesday.
In practice, buyers above $10M ARR run both a revenue multiple and an earnings multiple and negotiate somewhere between them. If those two methods produce wildly different numbers for your business, that gap is itself informative. It usually means either that margins are being suppressed by investment that needs explaining, or that revenue quality is weaker than the topline suggests. Either way, expect the question.
One further consideration that is easy to miss: the basis a buyer selects tells you what they intend to do with the business. A buyer pricing on EBITDA is planning to run it. A buyer pricing on ARR is planning to grow it. Those two buyers will offer different structures, different earnout terms, and different roles for you after close, which is why buyer selection matters as much as buyer count. Our comparison of private equity, strategic, and individual buyers sets out how each type approaches the same asset.
What Earns a Premium, and What Triggers a Discount?
Two businesses in the same ARR band with the same growth rate can receive offers two turns apart. The difference sits in a set of factors that rarely appear in benchmark tables but appear in every diligence process.
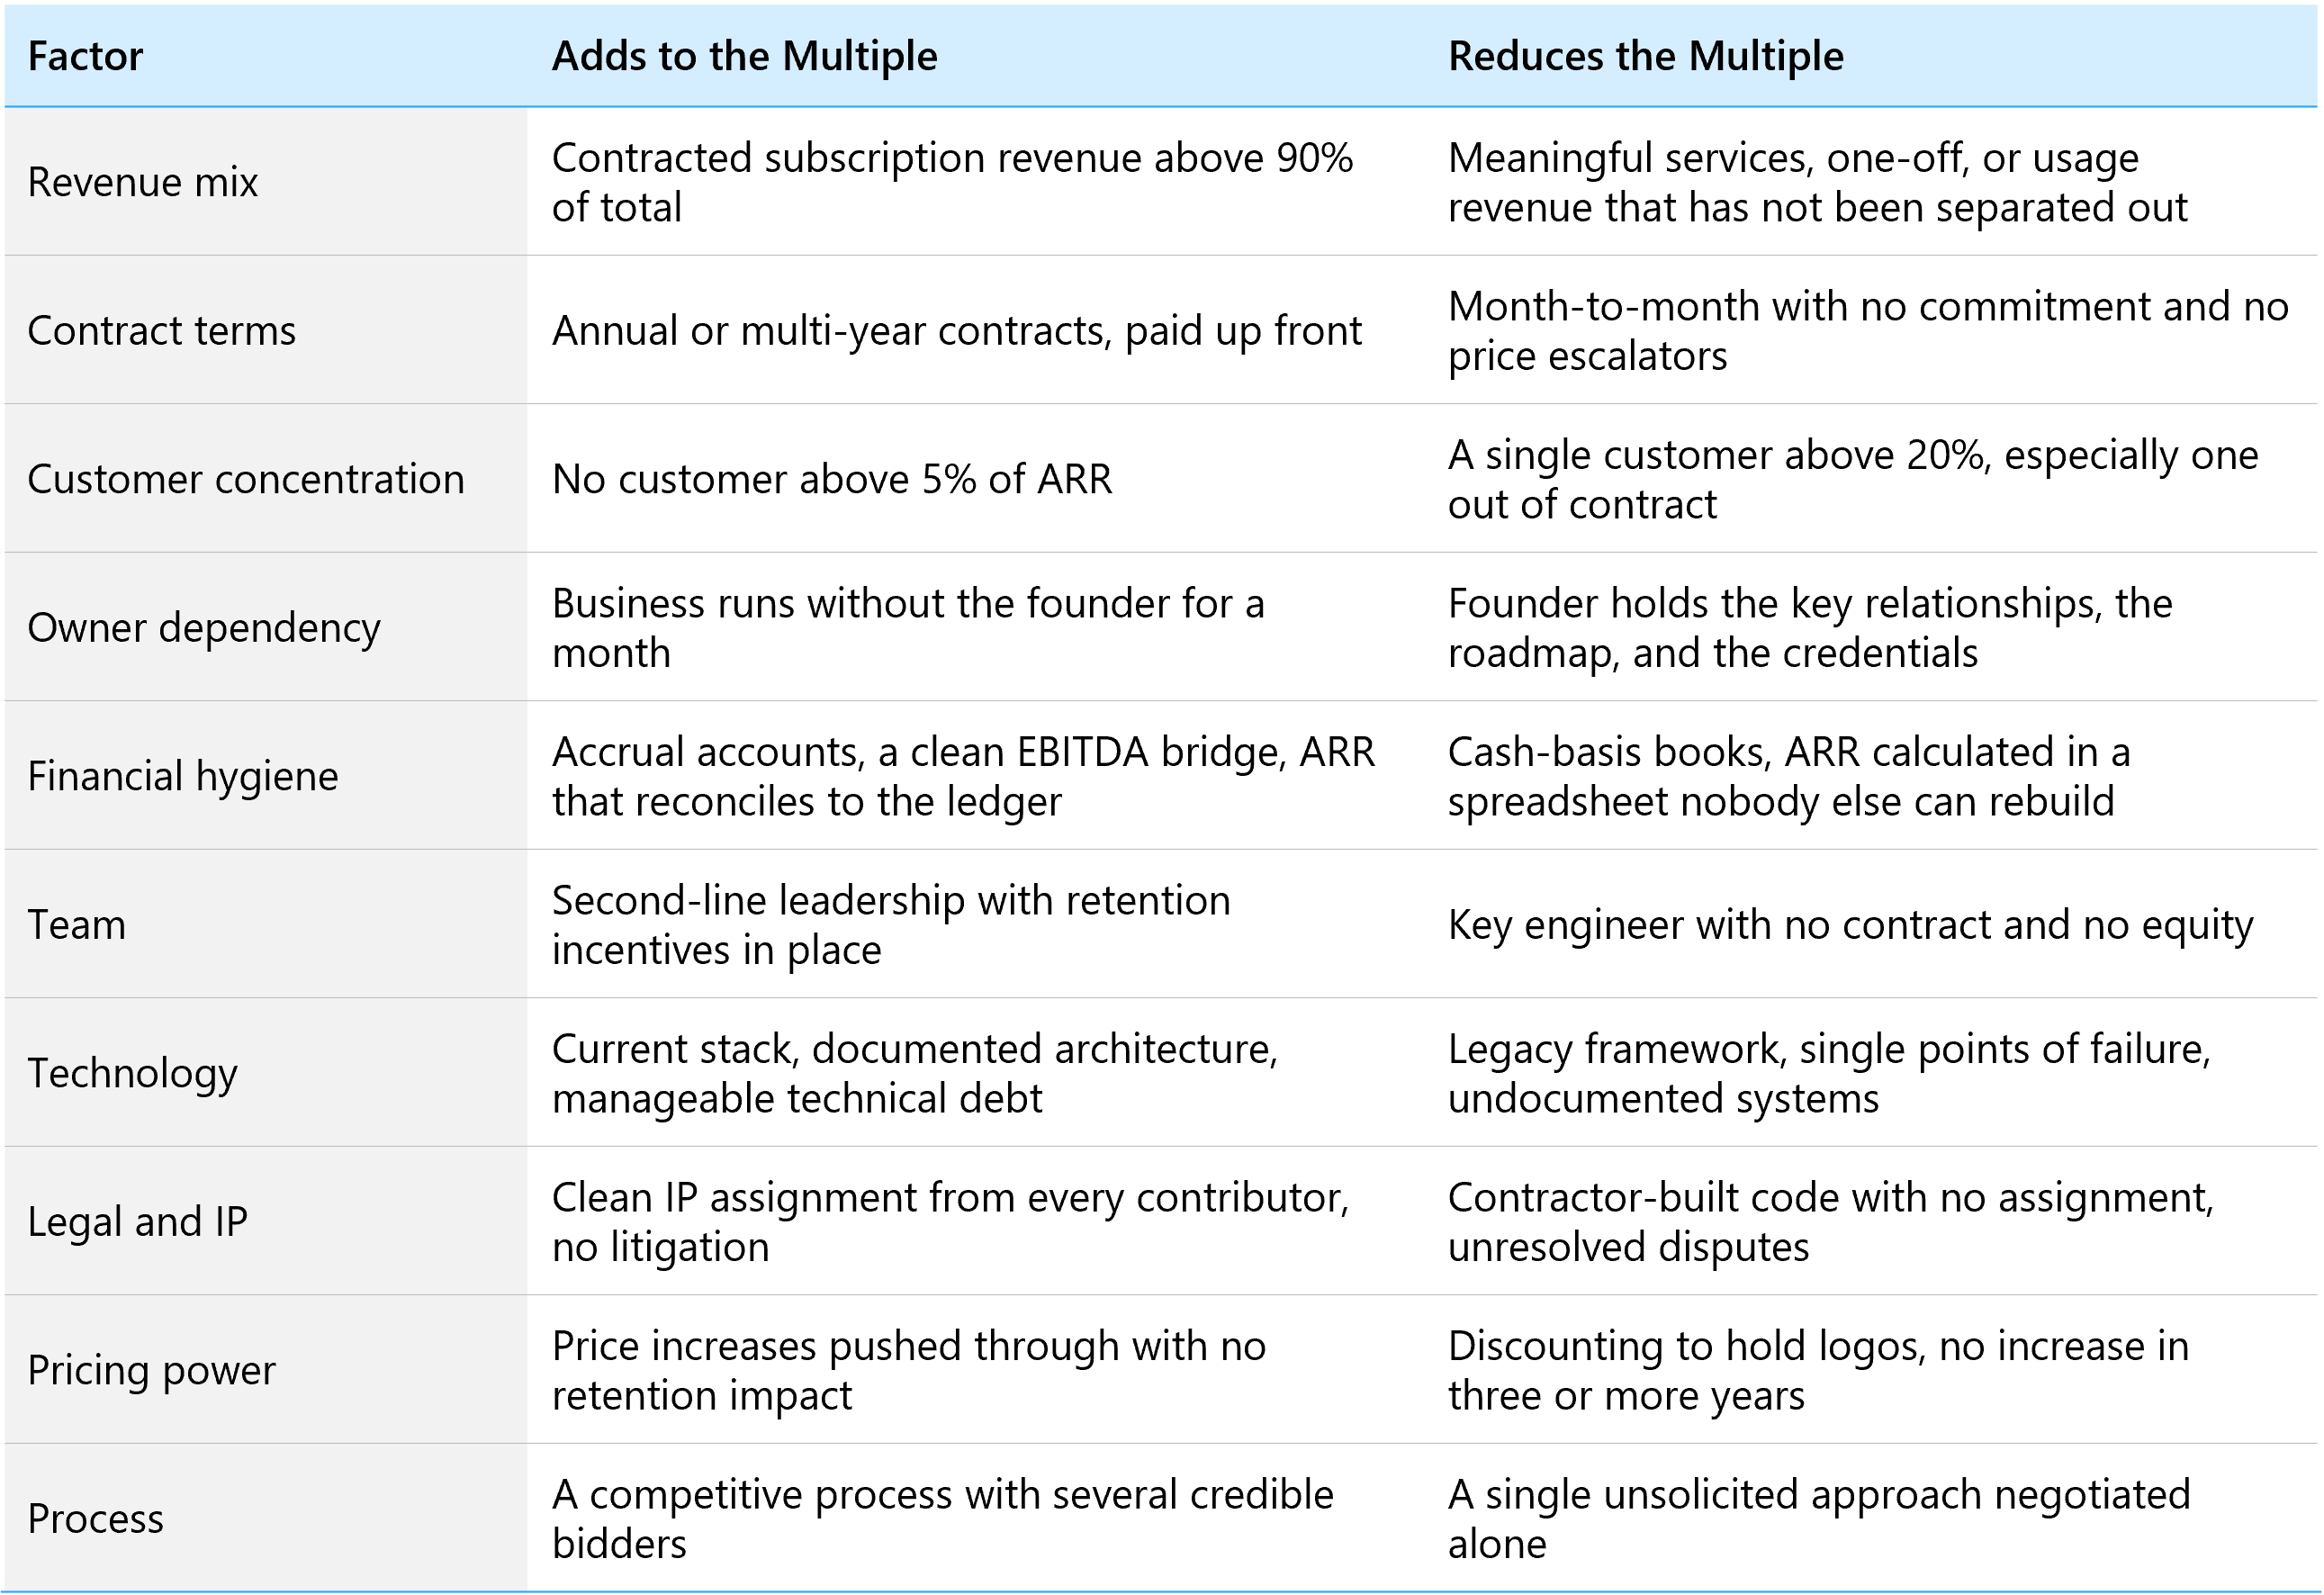
Based on FE International transaction experience across 1,500+ completed deals.
The last row in that table is the one founders control most directly and use least. The single largest determinant of a final number is often not a metric at all. It is whether more than one credible buyer wants the business at the same time. A seller negotiating alone with one interested party is discovering that party's reservation price. A seller running a structured process is discovering the market's.
Financial hygiene is the second most valuable and the most fixable. Buyers apply a risk discount to numbers they cannot verify quickly, and that discount is usually larger than the cost of getting the accounts in order. If your ARR figure cannot be rebuilt from your billing system by a third party in an afternoon, that is worth fixing well before you go to market.
A worked example makes the spread concrete. Two businesses come to market in the same quarter, both at $6M ARR, both growing 22%.
The first runs 108% net revenue retention and a 74% gross margin with services bundled into the software line. One customer represents 19% of ARR, the founder owns every enterprise relationship, and the accounts are kept on a cash basis. It attracts three buyers, two of whom fall away during diligence, and clears at 3.4x ARR with a fifth of the consideration in an earnout tied to the concentrated account renewing.
The second runs 121% net revenue retention with services broken out separately, leaving an 81% software gross margin. No customer exceeds 6%, a VP of sales owns the accounts, and the accrual accounts produce an ARR figure that reconciles to the billing system. It attracts seven buyers, four of whom submit offers, and clears at 5.8x ARR with 90% cash at close.
Same ARR. Same growth rate. Roughly $14M of difference in headline value, and a wider difference again in cash actually received on completion. None of that gap came from the market.
On timing, the useful frame is that the metrics buyers price are metrics you can move. Retention, margin separation, contract terms, and owner dependency all respond to deliberate work over 12 to 18 months. A focused programme across those four typically moves a multiple by one to two turns, which on a $8M ARR business is a materially different outcome. That is a better return than most growth initiatives available over the same period.
How Do Interest Rates, Buyer Type, Vertical, and Geography Shift the Range?
The benchmarks above describe a typical business. Four external factors move the range around it.
Interest rates and financing
Software multiples are sensitive to the cost of debt, because leveraged buyers solve for a return after financing costs. Rate movements from the Federal Reserve and a rate rise from the European Central Bank made leveraged buyouts harder to underwrite through the second quarter of 2026, pushing buyout value down while corporate-led M&A held firm above $890 billion. For a seller, the read-through is specific and actionable: when financing tightens, strategic acquirers become the strongest bid, because they fund deals from balance sheet and cash flow rather than from a debt package. Building a process around strategic buyers matters more in this environment than it did two years ago.
Buyer type
A strategic acquirer buying capability, distribution, or a customer base can justify a higher price than a financial buyer running a returns model, because the strategic is pricing synergies that a sponsor cannot access. A private equity platform will pay well for a profitable, stable business with a clear path to a larger exit. An add-on acquisition into an existing platform is usually priced lower, since the seller is negotiating with one buyer in a relationship-driven conversation rather than a competitive one.
Vertical
Sub-sector matters, and in 2026 it matters more than usual. Cybersecurity and AI infrastructure have commanded the strongest pricing, with double-digit revenue multiples persisting in public markets for that cohort while broader application software repriced. Vertical software with deep workflow integration has held up better than horizontal tools, for the defensibility reasons set out earlier. Fintech carries its own dynamics around transaction volume, regulatory posture, and take rates, which we cover in our guide to valuing a fintech business. If you operate in one of these categories, benchmark against your sub-sector rather than against SaaS as a whole.
Market size and category
Total addressable market shows up in valuation less directly than founders expect, but it does show up. A buyer is not paying for the size of your market in the abstract. They are paying for the growth runway it implies. A business with $5M ARR inside a $200M niche is approaching saturation, and the buyer models a curve that flattens. The same $5M ARR inside a multi-billion-dollar category leaves room to compound, and the buyer models something steeper.
The nuance in 2026 is that category quality has overtaken category size. Bain observes that software penetration is topping out in some areas while other industries and functions still have room to grow, which means a well-defined niche with low penetration can be worth more than a large category already crowded with capable competitors. Present your market as a defensible position with a credible expansion path rather than as a headline number from an analyst report. Buyers discount market size slides. They do not discount evidence of expansion inside existing accounts.
Geography
Regional differences are real and currently favour cross-border buyers. European software marks declined 4.2% in the first quarter of 2026 against 8.9% in the US, which means European assets have held their value better while still pricing below comparable US businesses in absolute terms. North American buyers are active in Europe for exactly this reason. If you operate outside the US, a process that reaches US strategic acquirers is likely to surface your best number.
The macro backdrop supports all of this. Deal activity has been broad-based rather than concentrated, financing markets are open, and sponsors hold substantial capital they are under pressure to deploy. Around 80% of the M&A executives Bain surveyed expect to sustain or increase deal activity through 2026. Our mid-year 2026 technology M&A report covers volume, multiples, and the second-half outlook across each vertical in more depth.
What This Means for Your Exit
SaaS valuation multiples in 2026 reward preparation more than they reward timing. The benchmarks have normalised into ranges both sides can work with, buyers have capital and are engaging again at these entry points, and the distance between an average outcome and a strong one has widened rather than closed.
The variables that decide where you land are, almost without exception, variables you can influence. Retention. Margin separation. Contract structure. Owner dependency. Financial hygiene. And the number of credible buyers at the table at the same time. None of those depend on where the public index sits when you sign.
If you are considering a sale in the next 12 to 24 months, the most valuable thing you can do now is find out how your current metrics read to an acquirer, while there is still time to move them. FE International has advised on more than 1,500 completed transactions since 2010 with a 94.1% success rate and more than $50 billion in lifetime deal experience, across SaaS, ecommerce, fintech, cybersecurity, edtech, AI, agencies, and marketplace apps.
Request a confidential valuation to see where your business sits against the benchmarks in this guide, learn more about how we sell SaaS businesses, or explore the FE International M&A Platform if you would prefer to run a self-directed process.