


There is a 4.8x valuation gap sitting inside one metric. McKinsey’s analysis of more than 100 B2B SaaS companies found that companies in the top quartile of valuation multiples traded at a median 24 times revenue, against 5 times for the bottom quartile. The retention profile separating those two groups is narrower than most founders expect: 113% net revenue retention at the top, 98% at the bottom. Fifteen percentage points of retention, nearly five times the price.
That is why every SaaS churn rate benchmark you can find online is being read by two audiences with different purposes. Operators use benchmarks to set targets. Acquirers use them to price risk. The second reading is the one that decides what your business sells for, and it is far less forgiving, because a buyer does not accept your churn number. A buyer rebuilds it.
This guide covers both. You will get the four churn formulas that survive diligence, the benchmark anchors that are actually auditable rather than self-reported, the arithmetic error that makes roughly half of published churn figures wrong, how acquirers reconstruct your retention from raw customer data, and a 12-month plan to move the number before you go to market. Every figure is drawn from published research or audited company disclosures, and the year is stated on each one.
What SaaS churn rate means, and why it sets your exit price
SaaS churn rate is the percentage of customers, or of recurring revenue, that a subscription software business loses over a defined period. It is expressed monthly or annually, and it is always measured against a starting base rather than an ending one. A business that begins January with 800 customers and loses 24 of them during the month has a 3% monthly customer churn rate.
The importance of churn rate in SaaS comes down to something structural rather than sentimental. Recurring revenue is valuable precisely because it recurs, so any evidence that it does not recur attacks the foundation of the valuation rather than one line of it. A buyer paying a multiple of ARR is buying a stream of future payments. Churn is the discount rate on that stream, and it compounds.
Churn also does something growth does not: it degrades quietly. A business can post 40% year-over-year growth while losing a third of its logos annually, because new sales mask the leak. Acquirers know this, which is why retention is usually the first thing they isolate. Growth tells them how good your marketing is. Retention tells them whether the product is load-bearing.
Growth measures how well you sell. Retention measures whether the product is load-bearing. Buyers pay for the second one.
The financial impact of churn on SaaS revenue runs through three channels at once. It shrinks the revenue base you compound from. It raises the acquisition spend required to hold flat, which compresses margin. And it shortens customer lifetime value, which caps what any rational buyer can pay to acquire your customer relationships. The lifetime value formula makes the last point explicit: gross-margin-adjusted revenue per account divided by churn rate. Churn is the denominator, so it sets the ceiling on customer value directly.
SaaS churn rate versus retention rate
Churn rate and retention rate are the same measurement viewed from opposite ends. If monthly churn is 2%, monthly retention is 98%. They always sum to 100% over the same period and the same base. The difference is convention: churn is the standard operating metric because it isolates the loss you are trying to fix, while retention is the standard investor-facing metric because it frames the number favourably and because expansion revenue can push retention above 100% in a way that churn cannot express.
One practical consequence matters in a sale. Retention above 100% is only possible on a net basis, which means expansion revenue is being netted against losses. Any figure above 100% is therefore a net figure and contains an offset. A buyer will ask what the gross number underneath it is, and the honest answer is often materially worse.
How to calculate SaaS churn rate: the four formulas buyers check
There is no single SaaS churn rate calculation formula. There are four, they answer different questions, and a diligence team will ask for all four. Reporting only the flattering one is the most common self-inflicted wound in a sale process.
1. Customer churn, also called logo churn
This counts accounts lost, regardless of what they paid.
Customer churn % = (customers lost in period / customers at start of period) x 100
Losing 24 of 800 starting customers gives 3% monthly logo churn. Logo churn is the cleanest read on product-market fit because it treats every account equally, which is exactly why it can mislead on financial impact. Losing twenty accounts paying $200 a month is a different event from losing one paying $48,000 a year, and logo churn cannot tell them apart.
2. Gross revenue churn and gross revenue retention
This measures recurring revenue lost, with no credit for expansion.
Gross revenue churn % = ((churned MRR + contraction MRR) / starting MRR) x 100 Gross revenue retention (GRR) % = 100 - gross revenue churn %
Contraction belongs in the numerator. A customer who downgrades from a $900 plan to a $400 plan has not churned, but $500 of monthly revenue is gone, and excluding it is one of the most common ways published churn figures understate reality. GRR can never exceed 100%. That hard ceiling is what makes it the metric buyers trust most, because there is nothing to hide behind.
3. Net revenue churn and net revenue retention
This nets expansion against losses.
Net revenue churn % = ((churned + contraction - expansion - reactivation MRR) / starting MRR) x 100 Net revenue retention (NRR) % = 100 - net revenue churn %
NRR can exceed 100%, and when it does the business grows from its existing base with no new sales at all. This is the metric that carries the most valuation weight in 2026, and we cover the mechanics of that in our guide to net revenue retention and SaaS valuation. The caution is that a strong expansion motion can conceal a weak retention core, so NRR should never be presented without GRR beside it.
4. Converting monthly churn to annual, the mistake that misstates half of published benchmarks
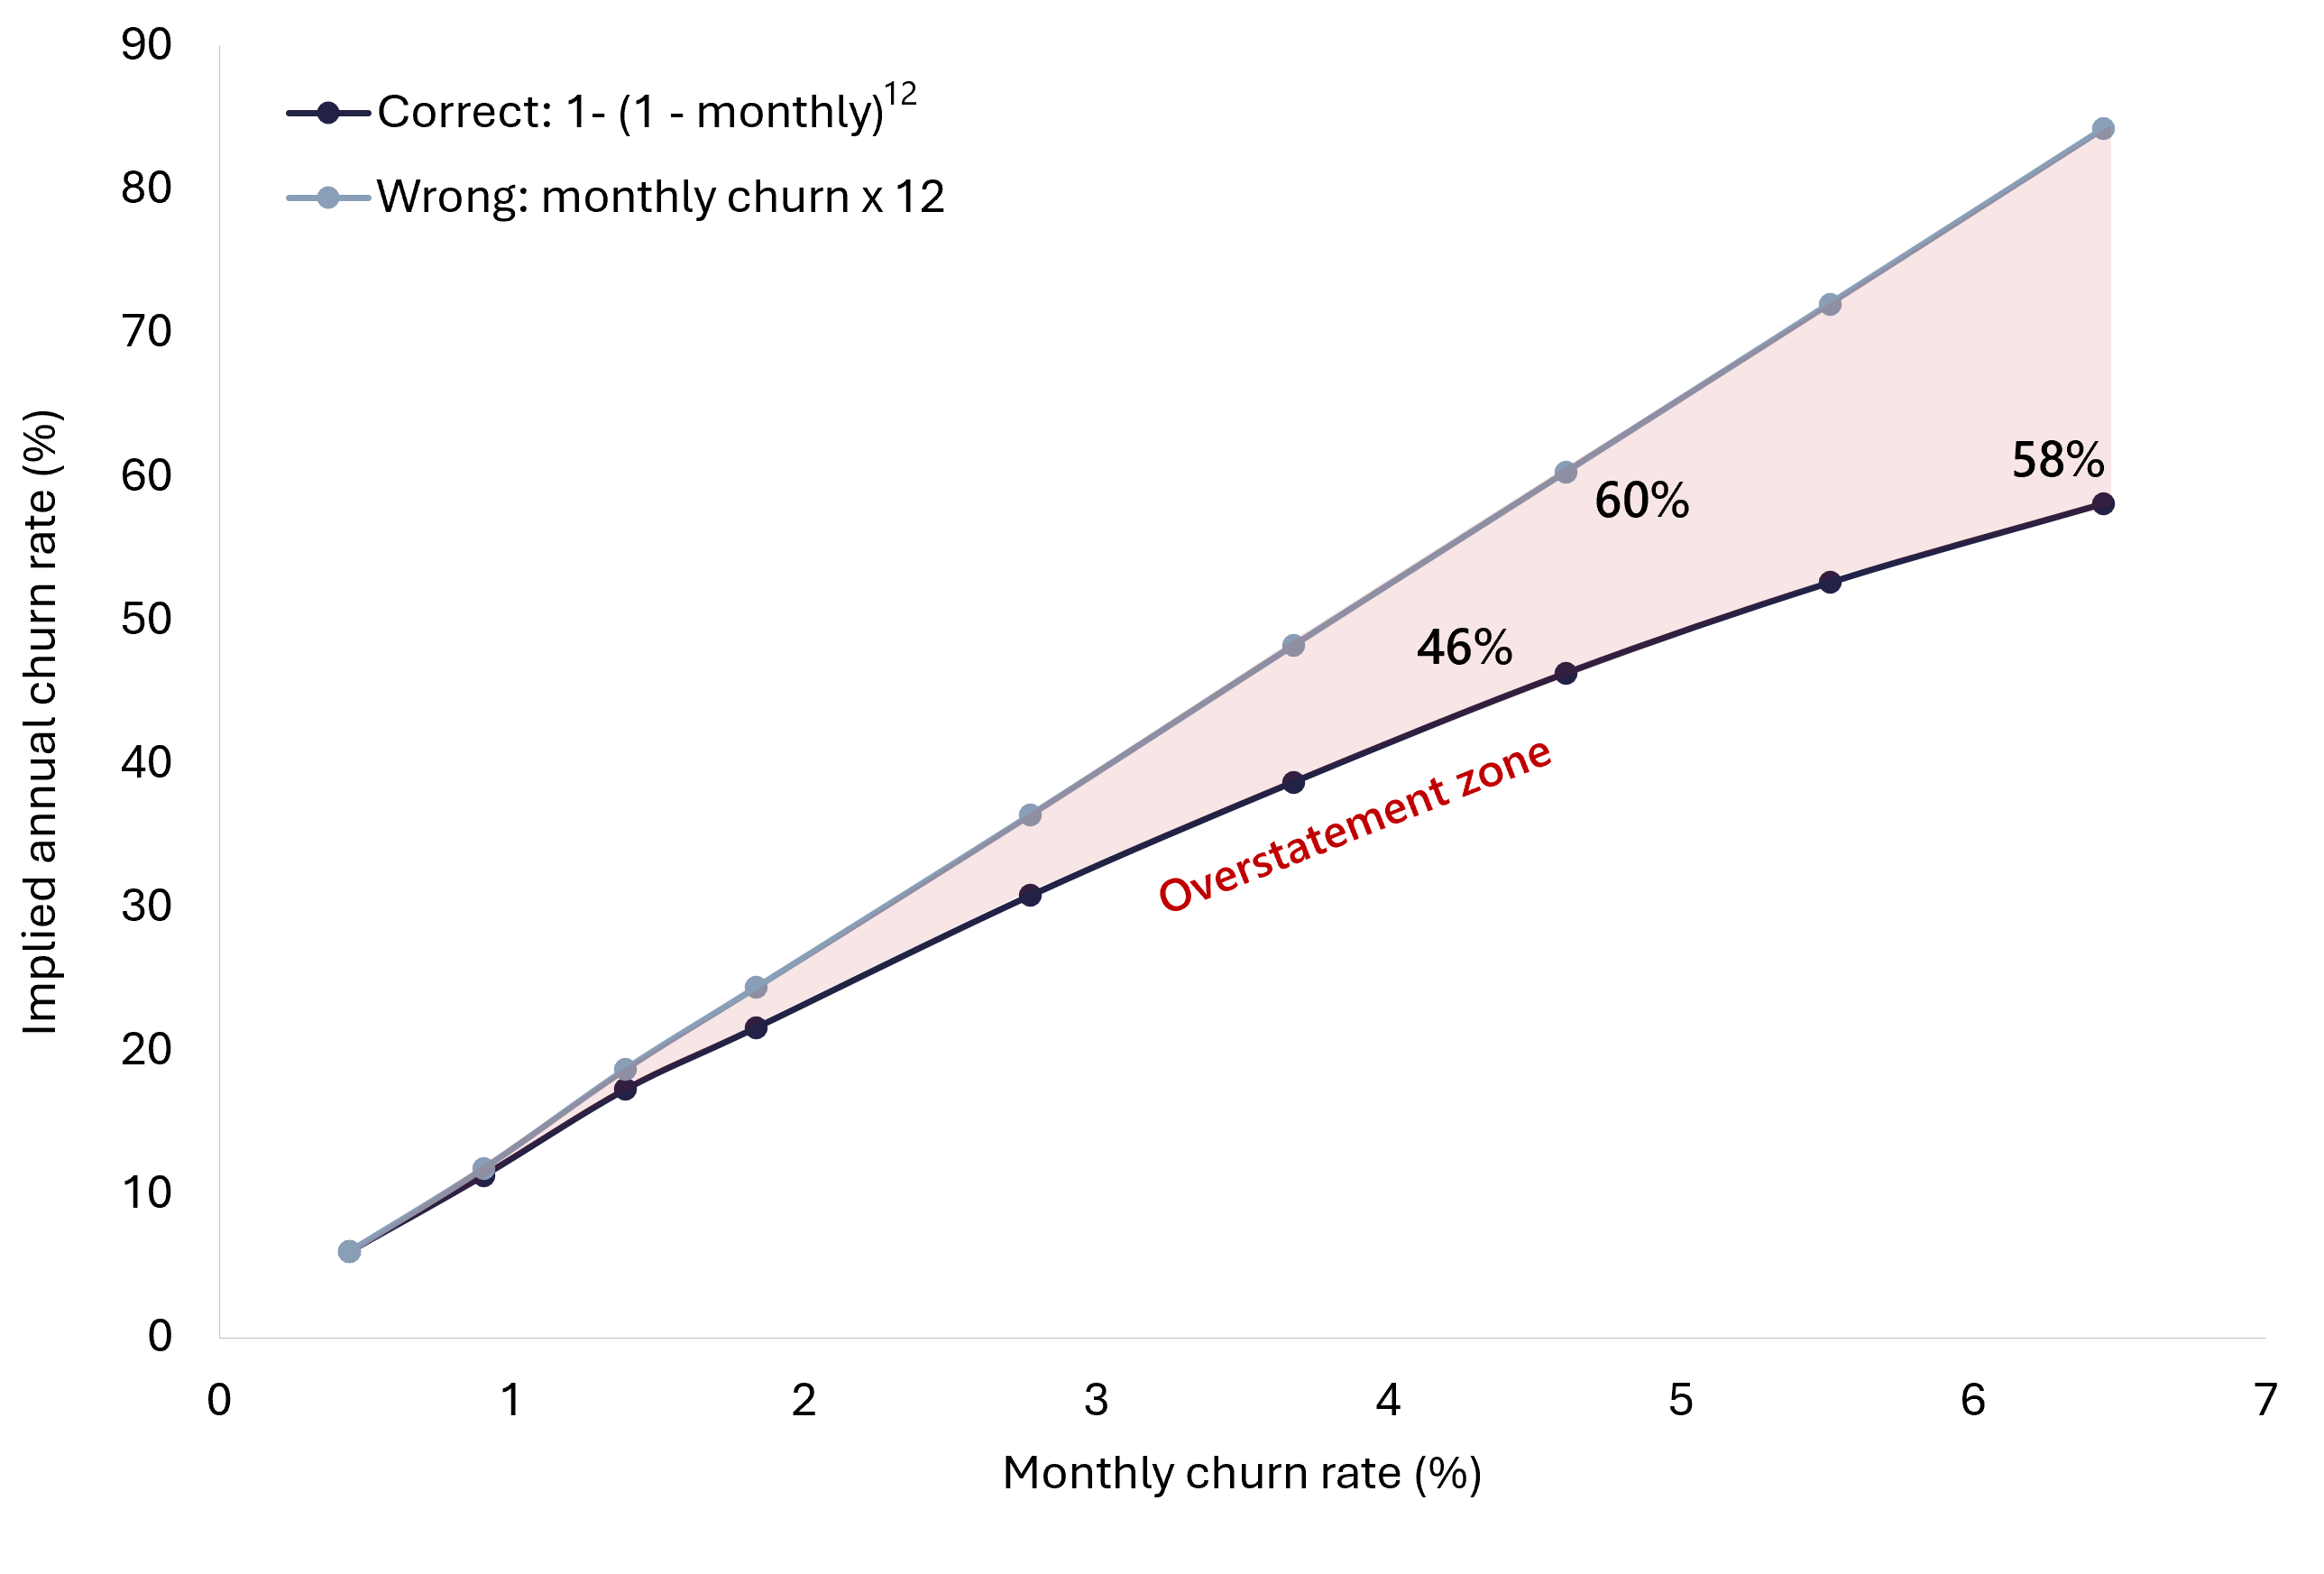
Monthly churn does not annualise by multiplication. It compounds, because each month’s loss applies to a base already reduced by the prior month.
Annual churn % = (1 - (1 - monthly churn)^12) x 100
At 5% monthly churn the correct annual figure is 46%, not 60%. At 3% monthly it is 30.6%, not 36%. At 7% monthly it is 58.1%, not 84%. The naive multiplication overstates annual churn by roughly a quarter in the mid-range, and it is the single largest reason two published SaaS churn rate benchmark tables can quote wildly different numbers while both claiming to describe the same companies. Run the conversion the other way and the asymmetry is just as important: a 3.5% annual churn rate is roughly 0.30% monthly, so anyone who reads a 3.5% annual median and then compares it against their own 3.5% monthly figure is off by more than an order of magnitude.
Seven definitional errors that distort the result
Before any benchmark comparison is meaningful, the calculation has to be clean. These are the recurring problems we see in seller-prepared churn data:
- New customers acquired during the period included in the denominator. This inflates the starting base and understates churn. The denominator is the base at period start, full stop.
- Contraction excluded from revenue churn, which hides downgrade-driven losses entirely.
- Trial and freemium users counted as customers, which manufactures churn that has no revenue consequence.
- Annual contract non-renewals logged on the cancellation-notice date rather than the contract-end date, which shifts losses into the wrong period and creates artificial spikes.
- Reactivated customers booked as new business, which double-counts acquisition and flatters net churn.
- Deepened discounts treated as neutral rather than as contraction MRR.
- Monthly and annual figures mixed inside the same trend line, which makes the series meaningless.
A one-point churn error propagates into lifetime value, CAC payback, and every revenue forecast built on top of them. Fix the definition before you benchmark the number.
SaaS churn rate benchmark 2026: which numbers are actually auditable
Here is the uncomfortable truth about the average SaaS churn rate in 2026. Most of the segment tables in circulation trace back to a small number of datasets that are either billing-platform panels, which reflect whichever companies happen to use that billing provider, or self-reported founder surveys, which are unaudited. Neither is wrong. Both are narrow. And because they define churn differently and measure over different windows, they produce figures that contradict each other by an order of magnitude while describing overlapping populations.
So rather than restate numbers that cannot be traced, the more useful approach is to anchor on retention data that is audited or independently researched, then show you how to derive a comparable figure for your own business.
The auditable anchors
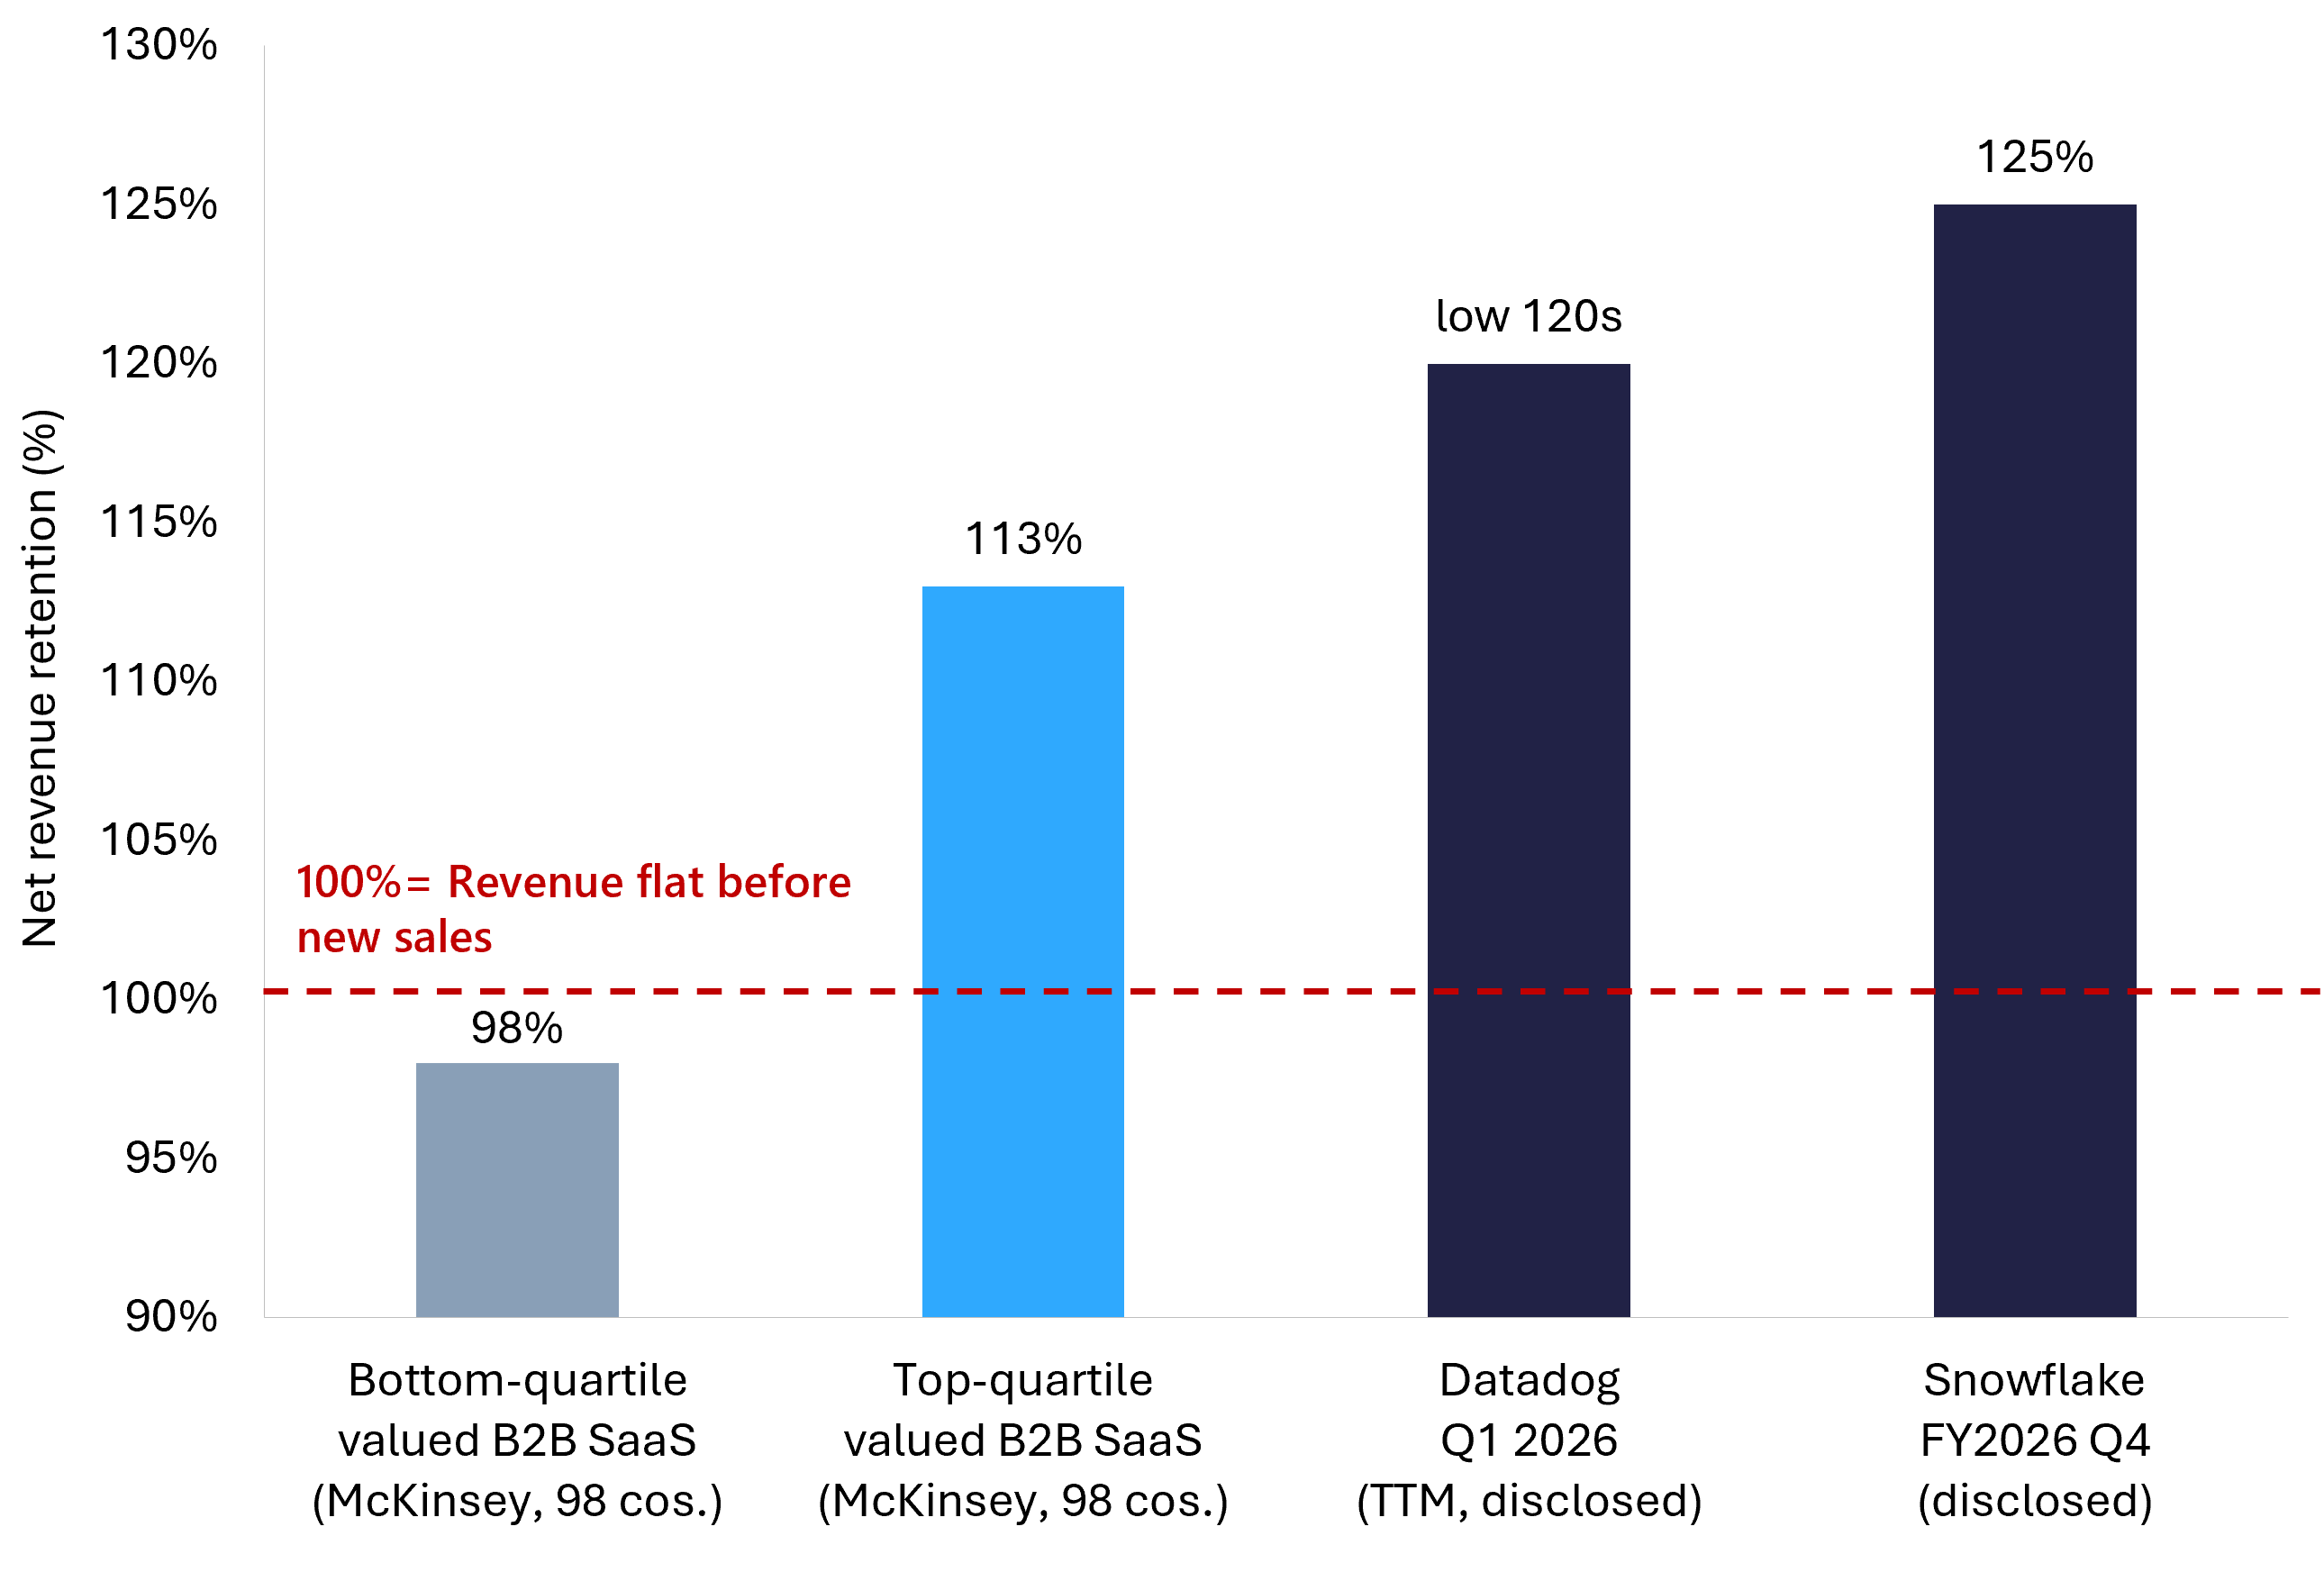
Public SaaS companies disclose retention in regulated filings, which makes those figures the most reliable reference points available. Snowflake closed fiscal 2026 with a net revenue retention rate of 125%, on full-year revenue of $4.68 billion, and its published methodology is instructive: it measures a trailing two-year cohort and leaves churned customers in the calculation contributing zero, so the number cannot be flattered by dropping losers from the base. Datadog reported first-quarter 2026 revenue of $1,006 million, up 32%, with roughly 4,550 customers above $100,000 in ARR against about 3,770 a year earlier; on its earnings call the company put trailing-twelve-month net revenue retention in the low 120% range with gross revenue retention stable in the mid-to-high 90s.
For private companies, the strongest independent reference is McKinsey’s survey of 98 B2B SaaS businesses, which places top-quartile-valued companies at 113% NRR and bottom-quartile at 98%. Read together they give a defensible ladder: high-90s GRR with 120% or better NRR is elite, 113% NRR is the threshold for premium valuation treatment, and 98% NRR is where the discount begins.
Why every published churn benchmark contradicts the next one
Three variables explain almost all of the divergence. Dataset composition: a panel drawn from self-serve billing tools skews toward low-ACV products with structurally higher churn, while a survey of venture-scale companies skews the other way. Definition: logo churn, gross revenue churn, and net revenue churn on the same company can differ by more than 20 percentage points. Window: monthly and annual figures get quoted interchangeably, and the conversion above shows how far apart they sit.
The practical rule is that a benchmark is only usable when its numerator, denominator, segment, and period all match yours. "What is the average churn rate?" is close to unanswerable. "What is the benchmark for a company with my ACV, contract length, and buyer type?" is the question that has a defensible answer.
B2B versus B2C churn, and why ACV drives the spread
The consistent pattern across every credible dataset is that churn falls as annual contract value and contract length rise, and this single relationship explains more variance than industry vertical does. B2B SaaS with annual contracts, procurement involvement, and implementation cost carries structurally lower churn than B2C or prosumer software bought on a credit card in ninety seconds and cancelled just as fast. Enterprise agreements add switching friction through integrations, data migration, security review, and internal training, none of which exist in a self-serve funnel.
For benchmarking purposes this means ACV band is the primary axis and vertical is secondary. A vertical B2B product at $40,000 ACV has far more in common with a horizontal B2B product at $40,000 ACV than it does with a consumer app in its own category. When a buyer segments your base, ACV is almost always the first cut they make.
Churn by stage, vertical, and business model
Stage changes what a given churn rate means. Below roughly $1 million in ARR, a high churn rate is diagnostic rather than fatal, because the business is still resolving who its ideal customer is and a portion of the base was mis-sold. What matters at that stage is the trajectory by cohort: recent cohorts retaining better than older ones is evidence that positioning is converging. The same absolute number at $10 million ARR reads very differently, because by then the ideal customer profile should be settled and churn is measuring product value rather than targeting error.
This is why acquirers evaluating early-stage SaaS churn benchmarks for startups weight the second derivative more heavily than the level. A business improving from 6% to 3% monthly churn across four consecutive quarterly cohorts tells a better story than one flat at 3.5% for two years, even though the second looks better on a single-period snapshot.
Vertical effects are real but smaller than people assume
Vertical differences are mechanical rather than mysterious. Infrastructure and developer tooling retains well because it embeds into build pipelines and production systems, so removal carries engineering cost and risk. Education technology carries structurally higher churn because institutional budgets are annual, seasonal, and politically contested, and because consumer-side learning products face natural completion. Fintech retention tracks regulatory embeddedness and transaction volume rather than seat count. Agency and marketing tools sit between the two, exposed to their clients’ own budget cycles.
The useful generalisation is that churn is a function of switching cost, not of industry label. Ask what breaks when a customer removes your product on a Friday afternoon. If the honest answer is "a report stops being generated," retention will be structurally weak whatever the vertical. If the answer is "production deploys stop and three integrations fail," it will be structurally strong.
Consumption pricing changes the shape of retention
Consumption-based and usage-based models produce a distinctive retention profile: high NRR during customer growth, because revenue expands automatically as usage rises without any renewal negotiation, but sharper contraction when customers optimise spend. Snowflake’s 125% NRR and Datadog’s low-120s figure both reflect this dynamic. The valuation implication is that a buyer will scrutinise consumption-model NRR more carefully than seat-based NRR, because the expansion is less contractually locked and can reverse without a churn event ever being recorded.
What churn does to your valuation multiple
The clearest quantification available comes from McKinsey’s work across more than 100 B2B SaaS companies over the period from the first quarter of 2019 to the fourth quarter of 2024: top-quartile valuation companies traded at a median 24 times revenue against 5 times for the bottom quartile, and the retention split between those groups was 113% NRR versus 98%. A parallel analysis of 55 B2B SaaS companies found that top-quartile NRR performers sustained higher valuations through both rising and falling markets, which is the property that matters most to an acquirer underwriting a five-year hold.
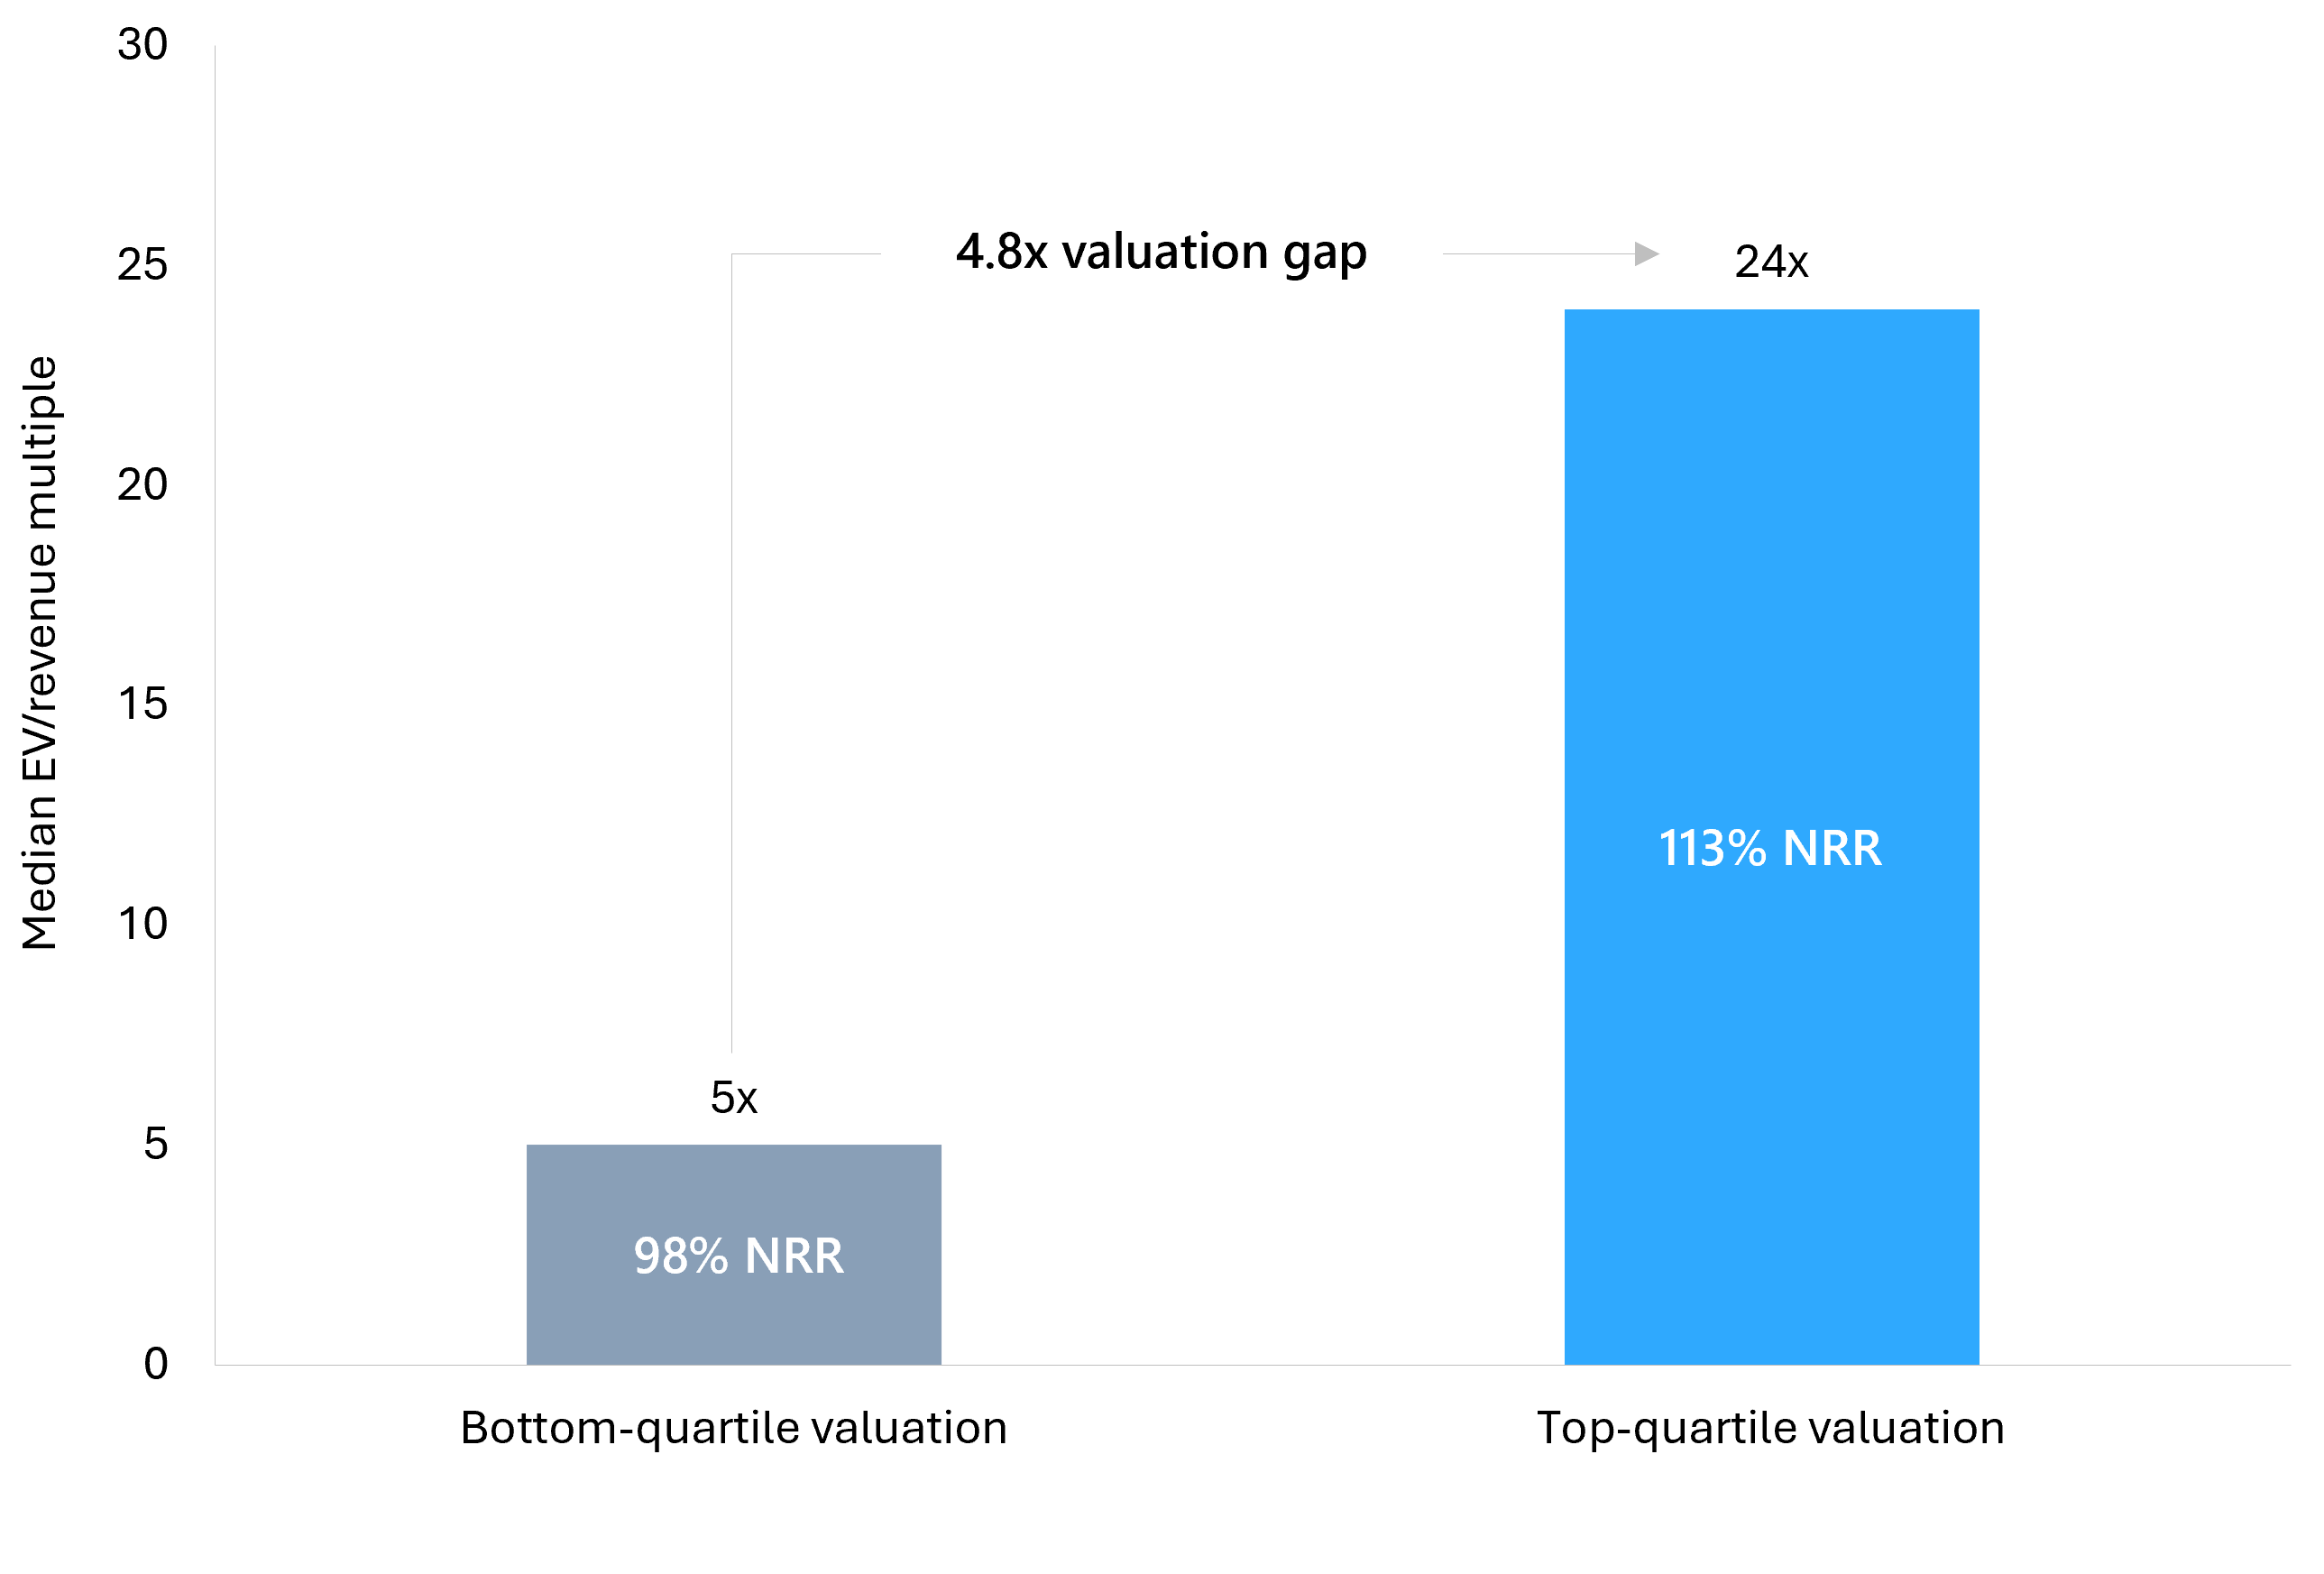
Fifteen points of net revenue retention separated a 5x business from a 24x business. Retention is not a KPI in a sale. It is a pricing input.
Churn rate versus growth rate: what buyers weight in 2026
For most of the last decade growth outranked retention in software valuation. That ordering has changed, and the reason is visible in the wider market. Software fundamentals have held up while sentiment has swung hard on questions of durability, and software equities recovered through mid-2026 after months in which investors discounted the sector on disruption risk rather than on any deterioration in reported retention. When the market cannot agree on how durable a revenue stream is, the metric that demonstrates durability gets repriced upward.
In practice buyers now read growth and retention as a pair rather than a ranking. High growth with weak GRR reads as an expensive acquisition treadmill and attracts a discount. Moderate growth with 115% NRR and mid-90s GRR reads as a compounding asset and attracts a premium. If you can only move one number in the twelve months before a sale, retention is the one that changes the multiple rather than just the numerator.
Churn, lifetime value, and the ceiling on what a buyer can pay
Lifetime value is gross-margin-adjusted average revenue per account divided by churn rate. Because churn sits in the denominator, small changes swing the result violently. Cutting monthly churn from 3% to 2% raises modelled lifetime value by 50%. This is the arithmetic reason retention improvements translate into multiple expansion rather than just revenue growth: they raise the theoretical maximum a rational acquirer can pay for each customer relationship, which lifts the whole valuation envelope rather than one input to it.
How acquirers rebuild your churn in due diligence
This is the section most churn guides skip, and it is where deals are actually won or lost. A buyer does not take a blended churn percentage on trust. They request raw customer-level billing data and reconstruct the metric themselves, and the reconstruction almost always produces a worse number than the one in the marketing deck. Our SaaS due diligence checklist walks the full workstream, but the retention-specific steps are these.
- Cohort reconstruction. Customers are grouped by signup month and tracked forward, which exposes whether retention is improving or whether a few large long-tenured accounts are propping up a blended average.
- Logo and revenue churn separated. Both are computed independently. A wide gap between them tells the buyer whether losses are concentrated in small accounts or large ones, and the second is far more expensive.
- Contraction extracted from NRR. Expansion and contraction are unbundled so the buyer can see the gross leak underneath a healthy net figure. Hidden contraction inside a strong NRR is one of the most common late-stage surprises.
- Concentration overlay. 2% churn on a base where the top three customers are 30% of revenue is not comparable to 2% on a diversified base. The buyer re-runs the model assuming a top account leaves.
- Voluntary and involuntary split. Failed payments, expired cards, and billing errors are treated as fixable and discounted less heavily. Voluntary cancellation is read as a product-value signal and priced accordingly.
- Non-renewal timing normalised. Annual contract losses are re-dated to contract end, which often relocates churn into different quarters and changes the trend line.
- Reconciliation to the financials. The rebuilt retention series is tied back to reported revenue. Any gap becomes a question, and unanswered questions become price adjustments.
The strategic conclusion is straightforward: build this analysis yourself before you go to market. A quality of earnings analysis performed on the sell side surfaces exactly what a buyer will find and lets you frame it with context rather than react to it under time pressure. If a buyer discovers a churn story you have not already explained, you lose control of the narrative and usually some of the price with it. If you present it first, with the cohort data and the remediation already in hand, the same facts read as operational command.
Every churn question a buyer answers for themselves costs you money. Every one you answer first buys you credibility on the rest of the numbers.
SaaS churn rate trends shaping 2026
Four forces are reshaping what a good SaaS churn rate benchmark looks like this year, and the net effect favours owners with clean retention.
Software spending is expanding, not contracting. Gartner forecasts worldwide software spending of $1.47 trillion in 2026, up 15.5%, within total IT spending of $6.37 trillion. Budget growth means churn is increasingly driven by competition rather than by budget cuts, and competitive displacement is a more tractable problem to fix than a disappearing line item. Products losing customers in a growing market are losing them to alternatives, and that is a positioning and value-realisation issue you can act on.
Switching costs are falling in some categories and rising in others. AI-assisted implementation and data portability have compressed the effort required to move between tools at the lighter end of the market, which raises the retention bar for products whose moat was migration friction. At the same time, products that embed into agentic workflows and proprietary data are becoming harder to remove than ever. The dispersion between these two groups is widening, and buyers are pricing the difference explicitly.
Customers demand proof of value, not promises. McKinsey’s B2B research found that eight in ten decision-makers will actively look for a new vendor when performance guarantees are absent. Retention increasingly depends on documented outcome delivery rather than relationship management, which changes what a customer success function has to produce.
Expansion has become the primary growth engine. 95% of chief sales officers expect faster growth from key accounts than from other accounts, and Gartner’s survey of 243 sales leaders found 73% prioritising growth from existing customers, with 57% ranking account retention and growth in their top three priorities. When the whole market pivots toward the installed base, retention performance becomes the main axis of competitive differentiation.
The deal environment reinforces all of this. Global M&A rose 40% to $4.9 trillion in 2025, the second-highest annual total on record, and 80% of the 300 M&A executives Bain surveyed expected to sustain or increase activity in 2026. Momentum has continued: deal value climbed 41% year over year to $2.4 trillion in the first five months of 2026 with median valuations holding at 11.6 times EV/EBITDA. PwC’s 2026 mid-year deals outlook describes AI reshaping the process itself, from target screening through diligence and valuation. Active buyers with capital and faster analytical tooling means well-prepared retention data gets rewarded quickly, and unexplained retention data gets found quickly.
How to reduce SaaS churn rate before you sell: a 12-month plan
Twelve months is the right horizon. Most churn improvement strategies fail in a sale process for one reason: they are started too late. Retention improvements need at least three or four quarterly cohorts to show up as a trend a buyer will credit, and a single good quarter reads as noise. McKinsey’s survey of 98 B2B SaaS companies quantified which practices actually move NRR, and the ranking is not what most teams assume, so the sequence below follows the evidence rather than intuition. Our exit planning work runs on the same timeline.
Months 1 to 2: fix involuntary churn first
Failed payments, expired cards, and billing errors produce churn that has nothing to do with product value. It is the fastest available win because it requires no product change and no customer conversation: payment retry logic, dunning sequences, card-updater services, and pre-expiry reminders. Two further reasons to do this first in a sale context. Buyers discount involuntary churn far less heavily than voluntary churn, so reclassifying losses correctly improves how your existing history reads. And the improvement lands within one billing cycle, which means it is visible in the trailing data by the time you go to market.
Months 2 to 4: install value realisation, the practice with the most measured impact
The single strongest finding in McKinsey’s research is that companies with the most sophisticated value-realisation and adoption journeys produce net revenue retention roughly seven percentage points higher than peers running only basic practices, and that just 18% of respondents had reached that level. That gap is the opportunity. In practice it means agreeing explicit onboarding and adoption targets with the customer at the outset, such as time to activate a defined number of users or adoption of specific high-value features, then reviewing delivery against those targets on a set cadence rather than at renewal.
Of all the SaaS customer retention techniques available, this one has the best evidence behind it, and the mechanism is simple. A customer who has documented what they gained does not treat renewal as a fresh purchasing decision. A customer who has not documented it treats every renewal as a chance to reconsider.
Months 3 to 6: pricing and packaging discipline, worth about 16 points
Pricing strategies do more for churn than most founders expect. McKinsey found that companies with best-in-class pricing and packaging practices recorded roughly 16 percentage points higher NRR on average than peers with basic practices, making this the largest single lever in the dataset. Six concrete moves come out of that work:
- Design packaging with predefined upsell paths so growth in customer value monetises automatically through capacity increases and add-ons.
- Tie tiers to multiple variables, such as users, storage, and data transfer, so customers have reason to upgrade even when only one dimension grows.
- Build cross-sell bundles that reward consolidating onto your platform rather than splitting spend across vendors.
- Use in-product journeys to drive trial and adoption of new functionality, which converts usage into expansion without a sales conversation.
- Write standard terms with explicit penalties for partial cancellation, reinstatement, and licence abuse, so contraction carries friction.
- Set discount policy that automatically reprices on partial churn, so a multi-product discount is removed when a customer drops a product.
That last point is the one most teams miss, and it is pure margin protection. A customer who drops two of five products while keeping the five-product discount has quietly moved you to worse unit economics without any churn being recorded.
Months 4 to 8: make retention measurable and owned
Two practices with heavy measured impact are organisational rather than product-related. Companies with best-in-class performance management achieved roughly 15 percentage points higher NRR than peers on basic practices, and those with best-in-class NRR reporting achieved about 13 points more, yet fewer than 20% of surveyed companies had reached best-in-class on both. The remedy is unglamorous: instrument NRR and its drivers at microsegment level, review it at a fixed cadence, and assign clear ownership across the three components of retention, pricing, and expansion, since no single leader usually controls all three. Build non-financial measures such as time to first value into account team incentives.
There is a second benefit specific to a sale. A business that already reports cohort retention monthly can hand a buyer a clean series on day one of diligence. A business that has to reconstruct it under deadline hands over something the buyer will then re-examine line by line.
Months 6 to 12: contract structure and the customer feedback loop
Structural changes take the longest to show in the data, so they go last but must start early enough to appear in trailing figures. Move monthly plans to annual where the customer economics support it, since annual commitments remove eleven cancellation decisions per year. Stagger renewal dates so no single quarter carries concentrated risk. Where multi-year terms are viable, they convert retention from a recurring negotiation into a contractual fact a buyer can underwrite.
On feedback, the discipline that matters is closing the loop rather than collecting scores. Satisfaction surveys and promoter scores describe sentiment, and sentiment is a lagging and weak predictor of cancellation. Effort and friction measures do better, because a customer who repeatedly struggles to complete a core task is telling you something behavioural rather than attitudinal. The operationally useful version is to route structured exit feedback and support-friction signals into a monthly review that produces product changes, then track whether the cohorts exposed to those changes retain better. Feedback that does not terminate in a shipped change has no effect on churn.
Predicting churn: early warning signals and analysis tooling
Churn prediction models exist to convert a lagging metric into a leading one. The prediction problem is straightforward in structure: score each account on behavioural signals, flag deterioration early enough to intervene, and measure whether intervention changed the outcome. The signals that carry most weight are product telemetry rather than relationship sentiment. Declining active users within an account, narrowing feature breadth, falling session frequency, a lapse in the core recurring workflow, support ticket escalation patterns, and the departure of the original internal champion are all observable before a renewal conversation and all precede cancellation by weeks or months.
McKinsey’s framing on analytics is worth adopting because it is a warning against over-building. Rather than constructing broad rules-based models that turn out not to predict anything, focus predictive effort on the highest-value use cases of adoption, retention, and cross-sell, and start with a minimum viable early-warning capability that actually runs. The same research classes product telemetry and customer segmentation as practices worth developing beyond the basics but not worth perfecting, while success planning and support offerings showed no additional NRR benefit from investment past a competent baseline. Knowing which practices have a ceiling is as valuable as knowing which have upside.
What churn analysis tooling actually needs to do
The tooling category matters less than the data architecture underneath it. Whatever combination of subscription analytics, product analytics, CRM, and business intelligence you assemble, it has to deliver five things: cohort retention computed from period-start bases, logo and revenue churn tracked separately, contraction and expansion recorded as distinct events, voluntary and involuntary losses tagged at the point of failure, and account-level health scores refreshed frequently enough to allow intervention before renewal. If your stack cannot produce a cohort retention table without manual spreadsheet work, that is the gap to close first, because it is also the artefact a buyer will ask for.
One measurement warning. A model that flags accounts your team then saves suppresses the very churn it predicted, which makes it look inaccurate. Track intervention outcomes separately from prediction accuracy, or you will retire a model that is working.
Preparing your retention story for market
Churn is the metric where operational reality and valuation meet most directly. The gap between 98% and 113% net revenue retention is fifteen points of operating performance and roughly five times the price, and closing part of that gap is achievable inside a twelve-month window with the sequence above. What is not achievable is closing it during diligence.
The businesses that command premium multiples are not always the ones with the best churn numbers. They are the ones that understand their churn well enough to present it with context, cohort by cohort, before a buyer asks. That preparation is what converts a defensible number into a defensible price.
FE International has advised on more than 1,500 completed transactions across SaaS, ecommerce, cybersecurity, fintech, edtech, AI, agencies, and marketplace apps. We build the retention analysis buyers will run, before they run it, and we position it inside a competitive process. If you are considering a sale in the next 12 to 24 months, request a confidential valuation to see how your current retention profile reads to acquirers, or speak with our team about a retention improvement plan ahead of going to market. You can also review how we sell a SaaS business, or explore the FE International M&A Platform if your business is below the $1 million threshold for full advisory.