


Global dealmaking just posted the strongest first half ever recorded. Announced M&A reached a record $2.8 trillion in the first six months of 2026, up 48% year over year and the highest first-half total since LSEG began tracking the market in 1980. Technology led every other sector, generating $649 billion in announced transactions.
This tech M&A mid-year 2026 report breaks down what happened in the first half, what it means for valuations, and where the second half is heading. We cover deal volume, the megadeals reshaping the market, valuation trends across SaaS, AI, cybersecurity, fintech, ecommerce, and agencies, the buyers writing checks right now, and the specific moves founders should make before year end.
The short answer for anyone weighing a transaction: conditions favor the prepared. Buyers are concentrating capital on fewer, higher-conviction targets, which means well-run technology businesses stand out and command premium attention. Capital is abundant, financing is wide open, and the acquirer pool spans strategics, private equity, and a growing base of individual buyers. At FE International, the global market leader in middle-market technology mergers and acquisitions, we see this daily across our advisory mandates and our M&A Platform, where buyers and sellers of technology businesses under $1 million transact directly. What follows is the data, vertical by vertical, translated into decisions.
Tech M&A at Mid-Year 2026: A Record First Half by the Numbers
The headline numbers set a high bar. The global M&A market is up 41% through the first five months of 2026 and on track for the second-highest year ever, extending the rebound that took hold in 2025. On a completed-and-announced basis, deal value rose approximately 28% against the same period last year, and BCG's M&A Sentiment Index has improved to 84. With the long-term average at 100, sentiment still has room to climb as the year progresses.
This builds on a powerful base. Global deal value hit $4.6 trillion in 2025, a 49% increase over 2024 and the highest annual figure since 2021. The momentum carried straight into January, and the first quarter of 2026 alone reached a five-year high.
Roughly 24,000 transactions were announced globally in the first half, about 9% fewer than a year ago. That is a feature of this market, not a flaw. Buyers are concentrating diligence resources and capital on the businesses they most want to own, which shortens processes for prepared sellers and widens the gap between average assets and quality ones. When fewer deals absorb more capital, the businesses that do come to market well-prepared meet deeper, more motivated buyer pools.
For technology specifically, the value and volume divergence is a pricing signal. Tech generated the most deal value of any sector while overall counts fell, meaning the average technology transaction got materially larger and buyer attention per deal got materially deeper. Founders should read that correctly: fewer, bigger, more thorough processes reward businesses that can withstand scrutiny, and they leave half-ready listings behind. Preparation has rarely converted more directly into price.
The one-line summary: the first half of 2026 was the strongest on record for global deal value, and technology was the largest sector of all, with $649 billion in announced transactions.
What Is Driving Tech M&A in 2026
AI sits at the center of nearly every major transaction thesis this year. It shaped the largest deals of the first half, redirected capital toward compute, data, and distribution, and pushed acquirers to secure positions across the AI value chain rather than watch competitors do it first.
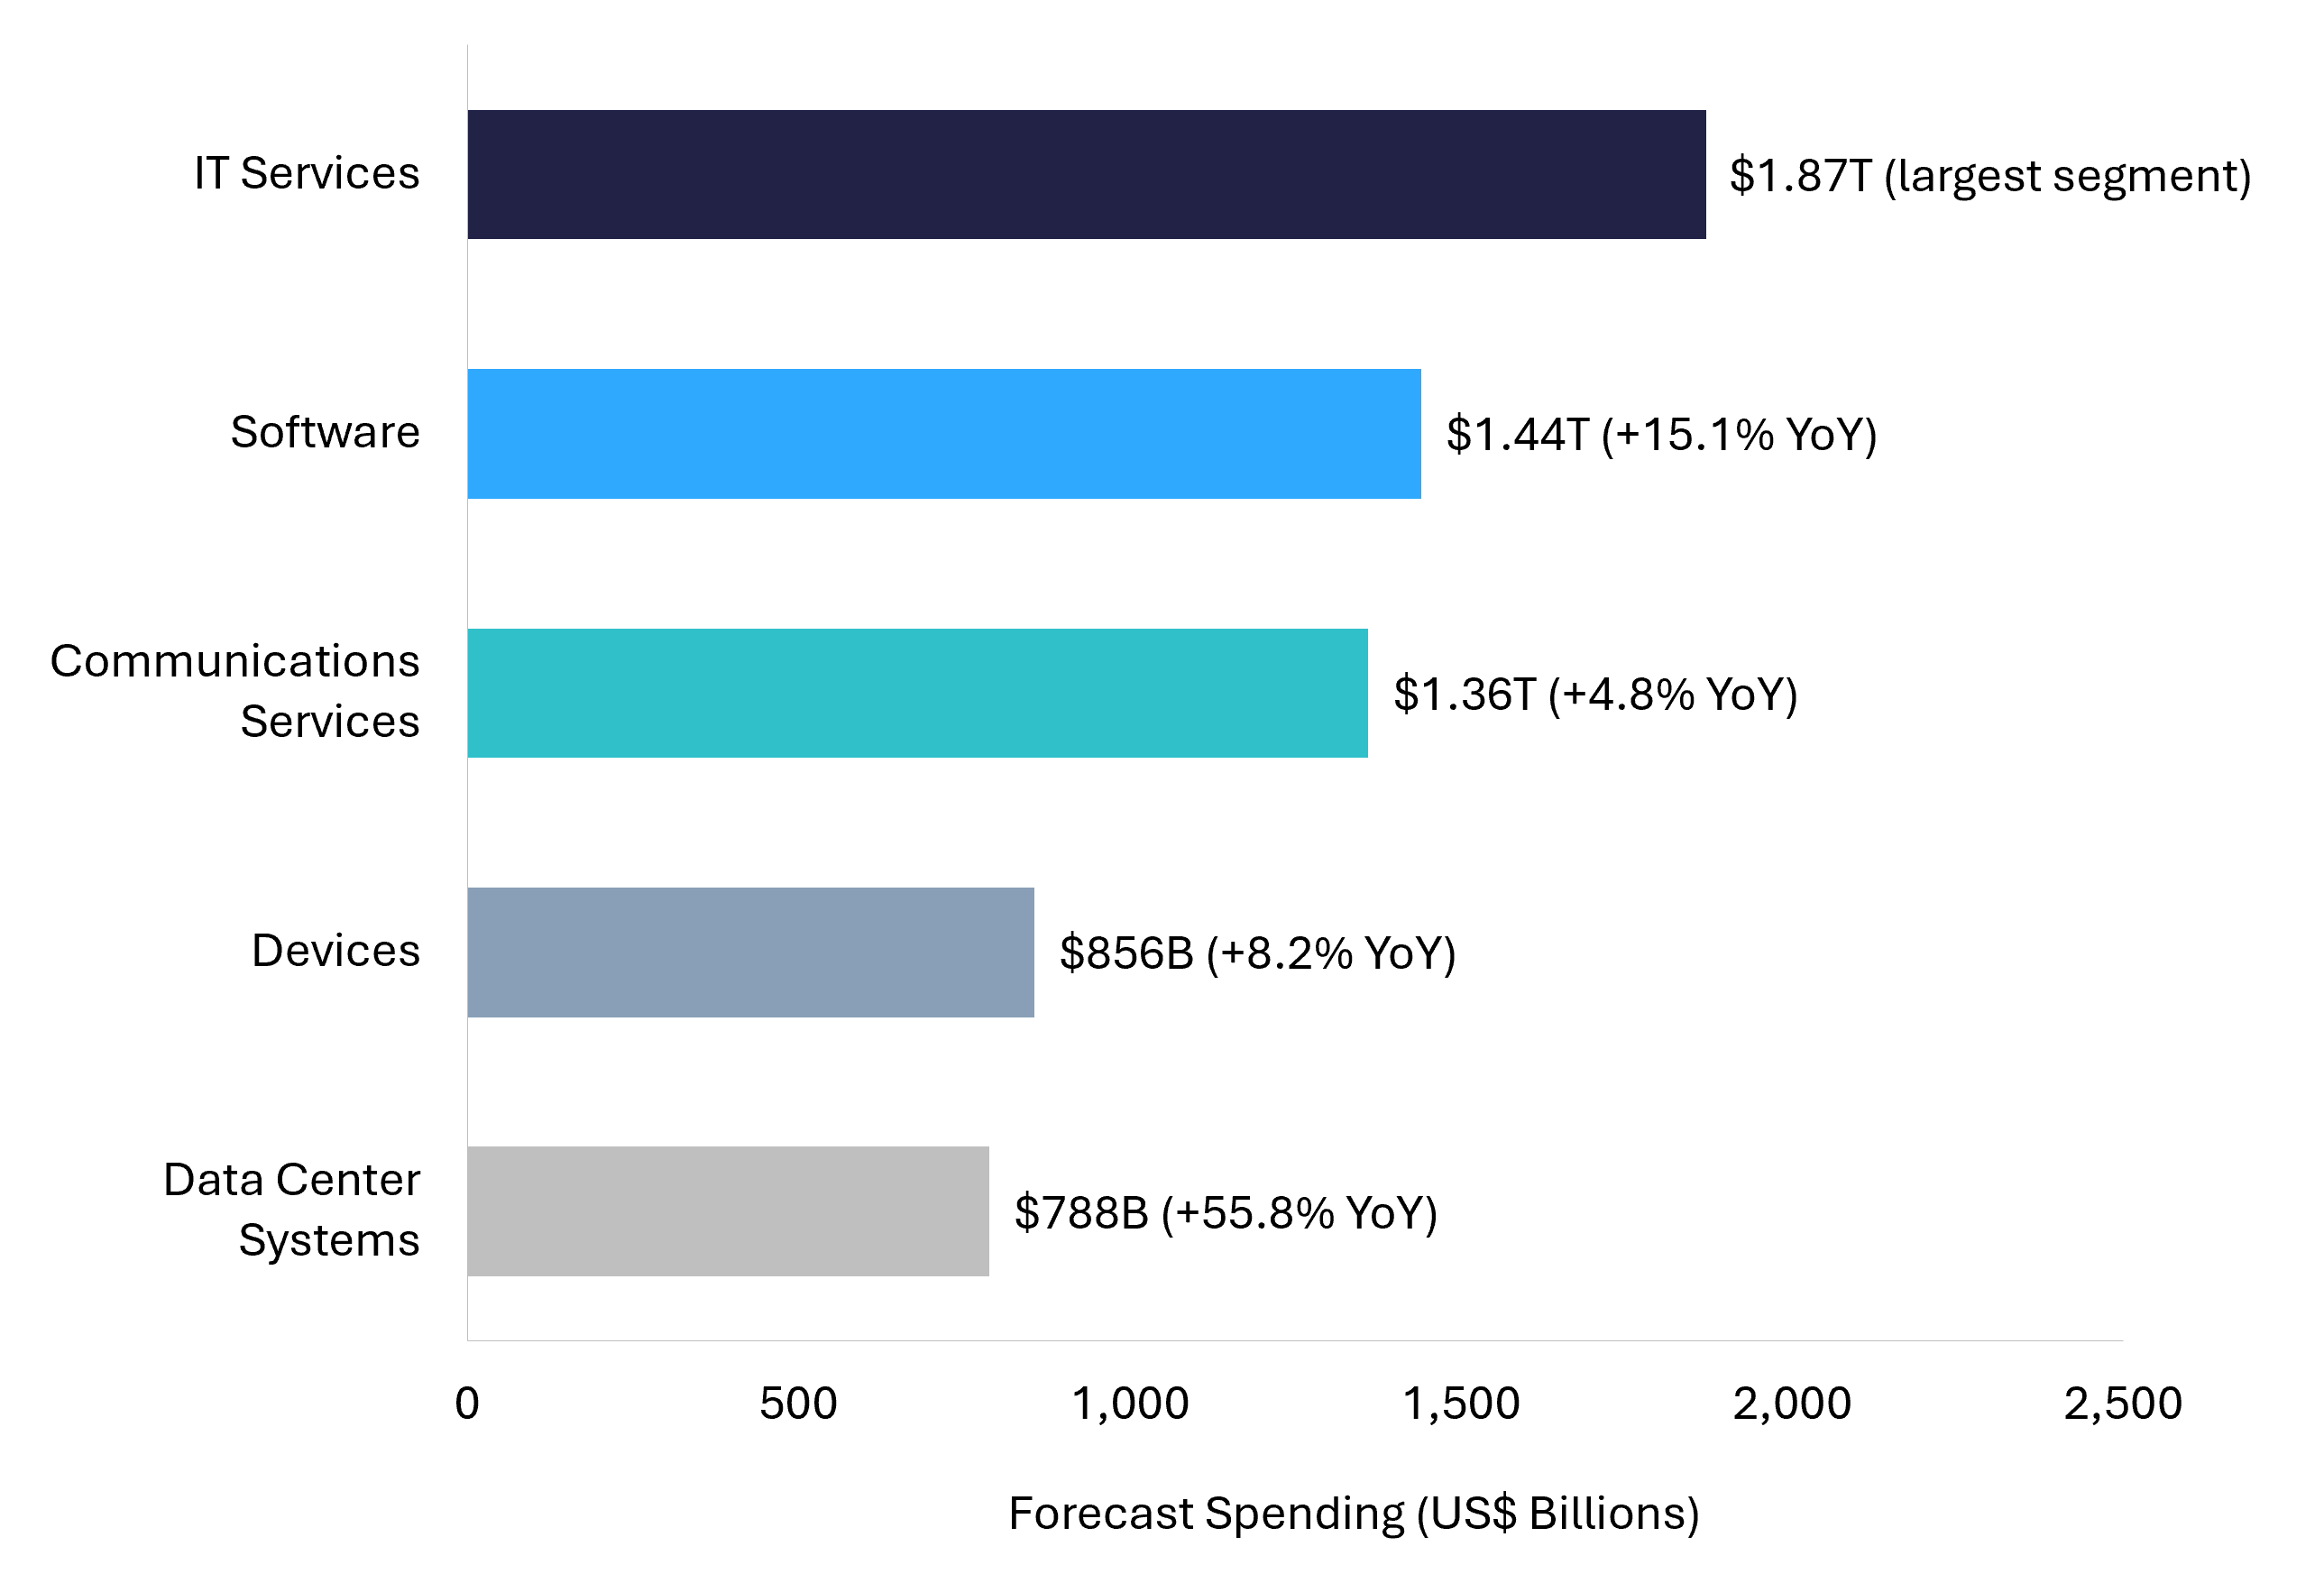
The spending environment underneath these deals keeps strengthening. Worldwide IT spending is forecast to reach $6.31 trillion in 2026, up 13.5% from 2025, with data center systems growing 55.8% and software spending up 15.1%. Buyers are not acquiring into a flat market. They are buying into the fastest expansion in enterprise technology budgets in years, and that supports both deal volume and the prices paid for growth assets.
Capability is the other engine. IT and professional services firms keep acquiring specialized AI startups to fold generative AI into workflows, customer service, and knowledge management. These deals are smaller than the megadeal headlines and strategically important, which is exactly the dynamic that benefits founder-led technology businesses: the most active buyers need what smaller companies have already built.
AI is also changing how deals get done. Generative AI now cuts deal timelines by 10% to 30% and reduces costs by roughly 20%. Faster diligence means faster closings, and it means buyers can evaluate more targets in parallel. Sellers with clean, well-organized financials capture the full benefit of that speed.
The strategic logic runs through the whole AI value chain. Acquirers want compute capacity, proprietary data, model capability, distribution, and the customer workflows where AI actually gets used, and no single company owns all five layers. That gap is being closed with acquisitions, minority stakes, partnerships, and long-term capacity agreements, often in combination. Every layer of that chain includes businesses of every size, which is why capability demand reaches so far down-market this year.
The Largest Tech Acquisitions and Most Active Acquirers So Far
Megadeals defined the first half. 47 transactions above $10 billion were announced, worth more than $1.3 trillion combined and accounting for nearly half of all global deal value, an all-time record. The marquee names tell the story: SpaceX agreed to acquire AI coding startup Cursor for roughly $60 billion, and NextEra Energy's $66.8 billion merger with Dominion Energy was built substantially on the energy demands of AI data centers.
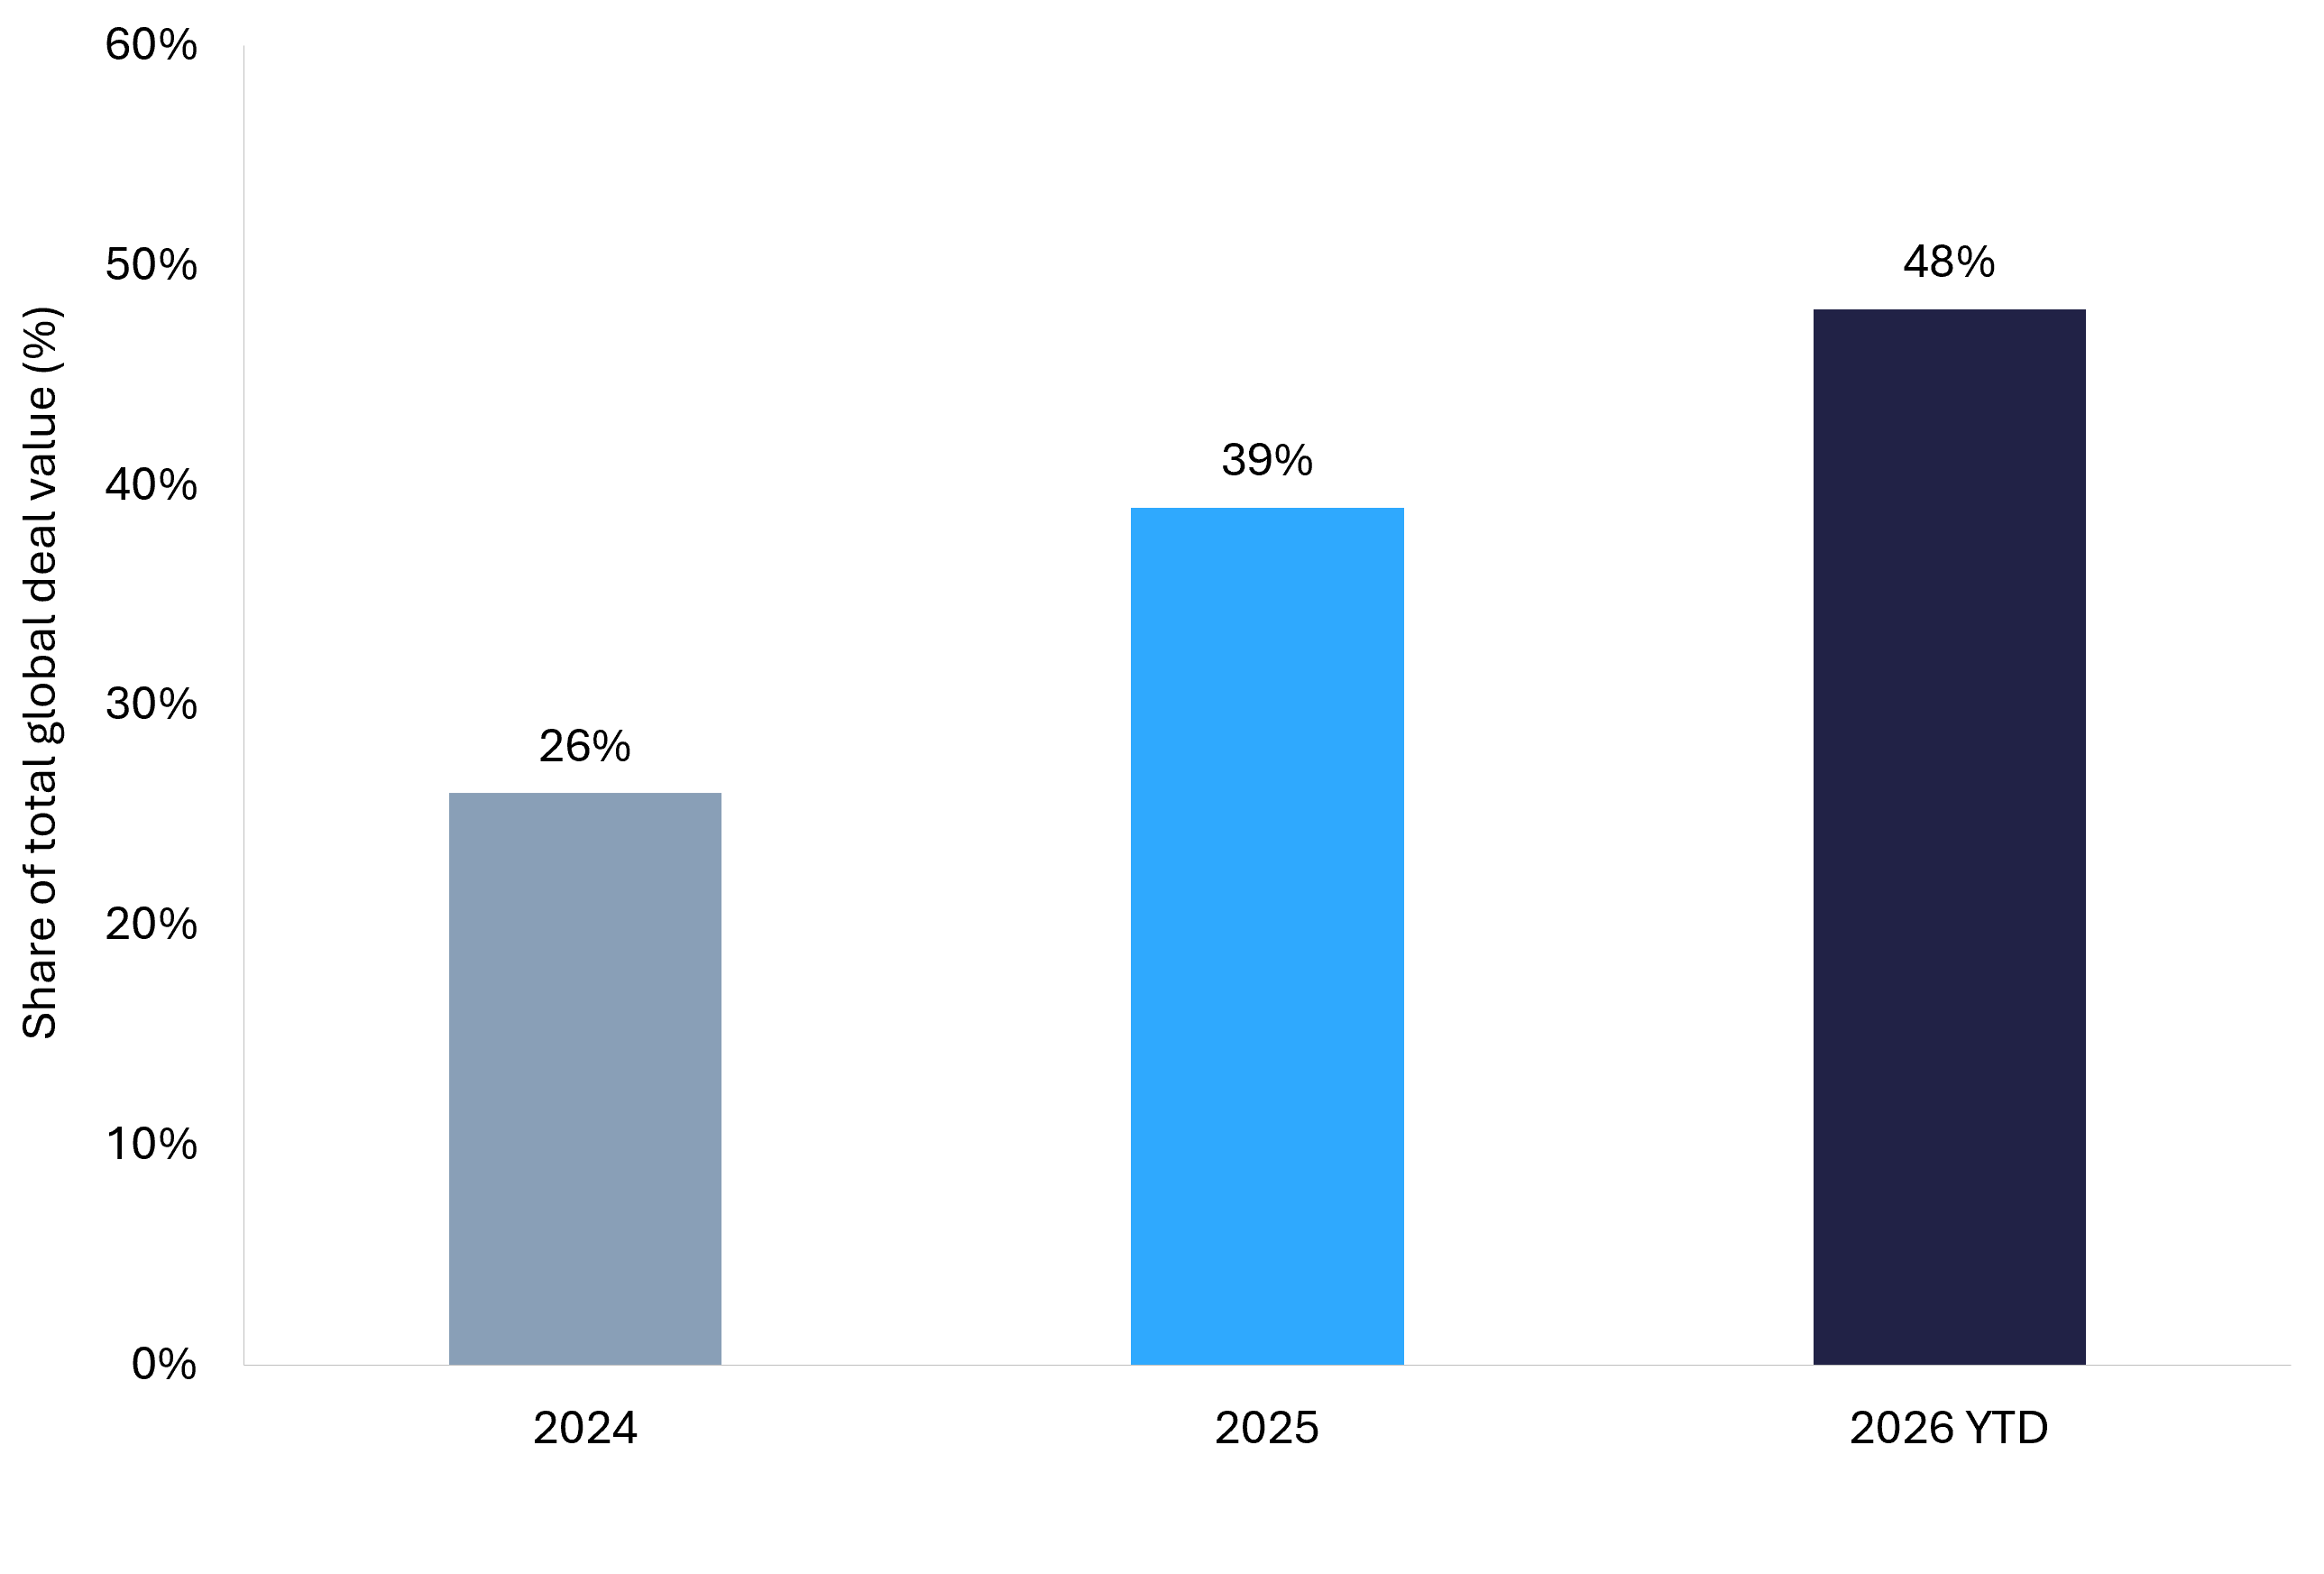
The structural shift is just as striking. Transactions above $5 billion now contribute 48% of total global deal value, up from 39% in 2025 and 26% in 2024. Scale begets scale. Each landmark deal resets what boards consider possible, and advisers report deep pipelines of follow-on activity into the second half.
On the acquirer league table for AI specifically, Salesforce was the most active buyer in 2025 with 10 AI acquisitions, followed by Workday, Meta, and CoreWeave with four each. That pattern has continued into 2026 as enterprise software leaders race to own agent infrastructure, data pipelines, and applied AI talent.
Here is the part the megadeal coverage misses: large combinations feed the middle market rather than starving it. Big acquirers run portfolio reviews after every landmark deal, sponsors are actively monetizing aging assets, and corporates are pursuing spin-offs alongside their acquisitions. Carve-outs and divested units become opportunities for mid-market strategics and PE platforms, and the capital raised in large exits recycles into the next generation of acquisitions.
Tech M&A Valuation Trends at Mid-Year 2026
Valuation is where the mid-year picture gets genuinely interesting, and the story is better than the headlines suggest. In public markets, the median enterprise SaaS company traded at 3.3x trailing twelve-month revenue at the end of Q1 2026, compared with 4.9x at year-end 2025 and 6.2x at year-end 2024. Multiples have normalized, and that normalization is producing the clearest valuation benchmarks buyers and sellers have had in years: realistic entry points for acquirers, and a credible baseline sellers can outperform with quality.
Underneath the multiple reset, the operating story keeps improving. Median EBITDA margins across the same public SaaS cohort are projected at 22.6% for 2026, up from 20.0% in 2025 and 17.4% in 2024, while median revenue growth holds at a healthy 12.7%. Software businesses are more profitable per dollar of revenue than at any point in the last cycle, which supports earnings-based valuations even as revenue multiples settle.
.png)
The market is paying up decisively for the right profile. AI-infrastructure and cybersecurity names continue to command double-digit revenue multiples in public markets, and in private strategic deals AI capability changes the math entirely: nearly half of strategic technology deal value above $500 million came from AI-native companies or transactions that explicitly cited AI benefits, roughly double the share from a year earlier.
For private technology businesses, the levers are consistent across verticals: net revenue retention above 100%, documented and defensible AI integration, diversified customer bases, and clean recurring revenue. Buyers reward evidence. A business that walks into diligence with normalized financials and a quality of earnings review holds its multiple; one that cannot substantiate its metrics negotiates from behind.
One more translation note for private sellers: public comps are the loudest benchmark, not the binding one. Private technology deals in the lower middle market price on SDE or EBITDA, with multiples anchored to transferability, revenue durability, and buyer competition, and private pricing has historically been steadier than public market swings in both directions. When public multiples normalize while private buyer demand deepens, the practical effect is a narrower bid-ask spread: buyers and sellers agree on value faster, and more deals close. That is exactly the pattern playing out at mid-year.
AI Company Acquisitions Set the Pace
No corner of the market is moving faster. The first quarter logged 266 AI M&A deals, up 90% year over year, alongside a record 21 AI IPOs. Private AI companies also raised $226 billion in Q1 2026 alone, more than they raised in all of 2025. The deal funnel is wider, the checks are larger, and the acquirer pool is more diverse than at any point in the AI era.
What changed is that AI revenue became real at scale. Anthropic's annualized run rate surpassed $30 billion in early 2026, up from roughly $9 billion at the end of 2025, while OpenAI reportedly topped $25 billion. Buyers are no longer underwriting promise. They are underwriting revenue, and that shift extends down-market: AI products with proven monetization attract strategic interest at every size.

By deal count, most AI transactions are capability buys: teams, models, data assets, and workflow products that slot into a larger platform. Hyperscalers, enterprise software leaders, PE-backed platforms, and services firms building AI delivery capacity are all bidding, often for the same assets. Acquirers hunting for AI businesses under $1 million can browse vetted listings with verified financials on FE International's M&A Platform, while our advisory team runs competitive processes for larger AI companies. The full breakdown of buyer types, deal structures, and the premiums AI-native businesses command is in our AI M&A trends analysis.
For startup founders, this is the most consequential shift of 2026: acquisition has become the primary exit path for venture-backed AI and software companies while the IPO window stays selective. That reality changes how smart founders build. Clean cap tables, documented IP ownership, transferable contracts, and a product that solves one problem exceptionally well are now exit strategy, not housekeeping. Acquirers absorbing startups this way also tend to retain technical teams, which keeps innovation compounding inside larger platforms rather than stalling after close.
Tech M&A Deals by Industry: A Vertical Snapshot
Deal activity is broad, but each vertical has its own buyers, metrics, and momentum. Here is where the first half landed across the sectors FE International advises.
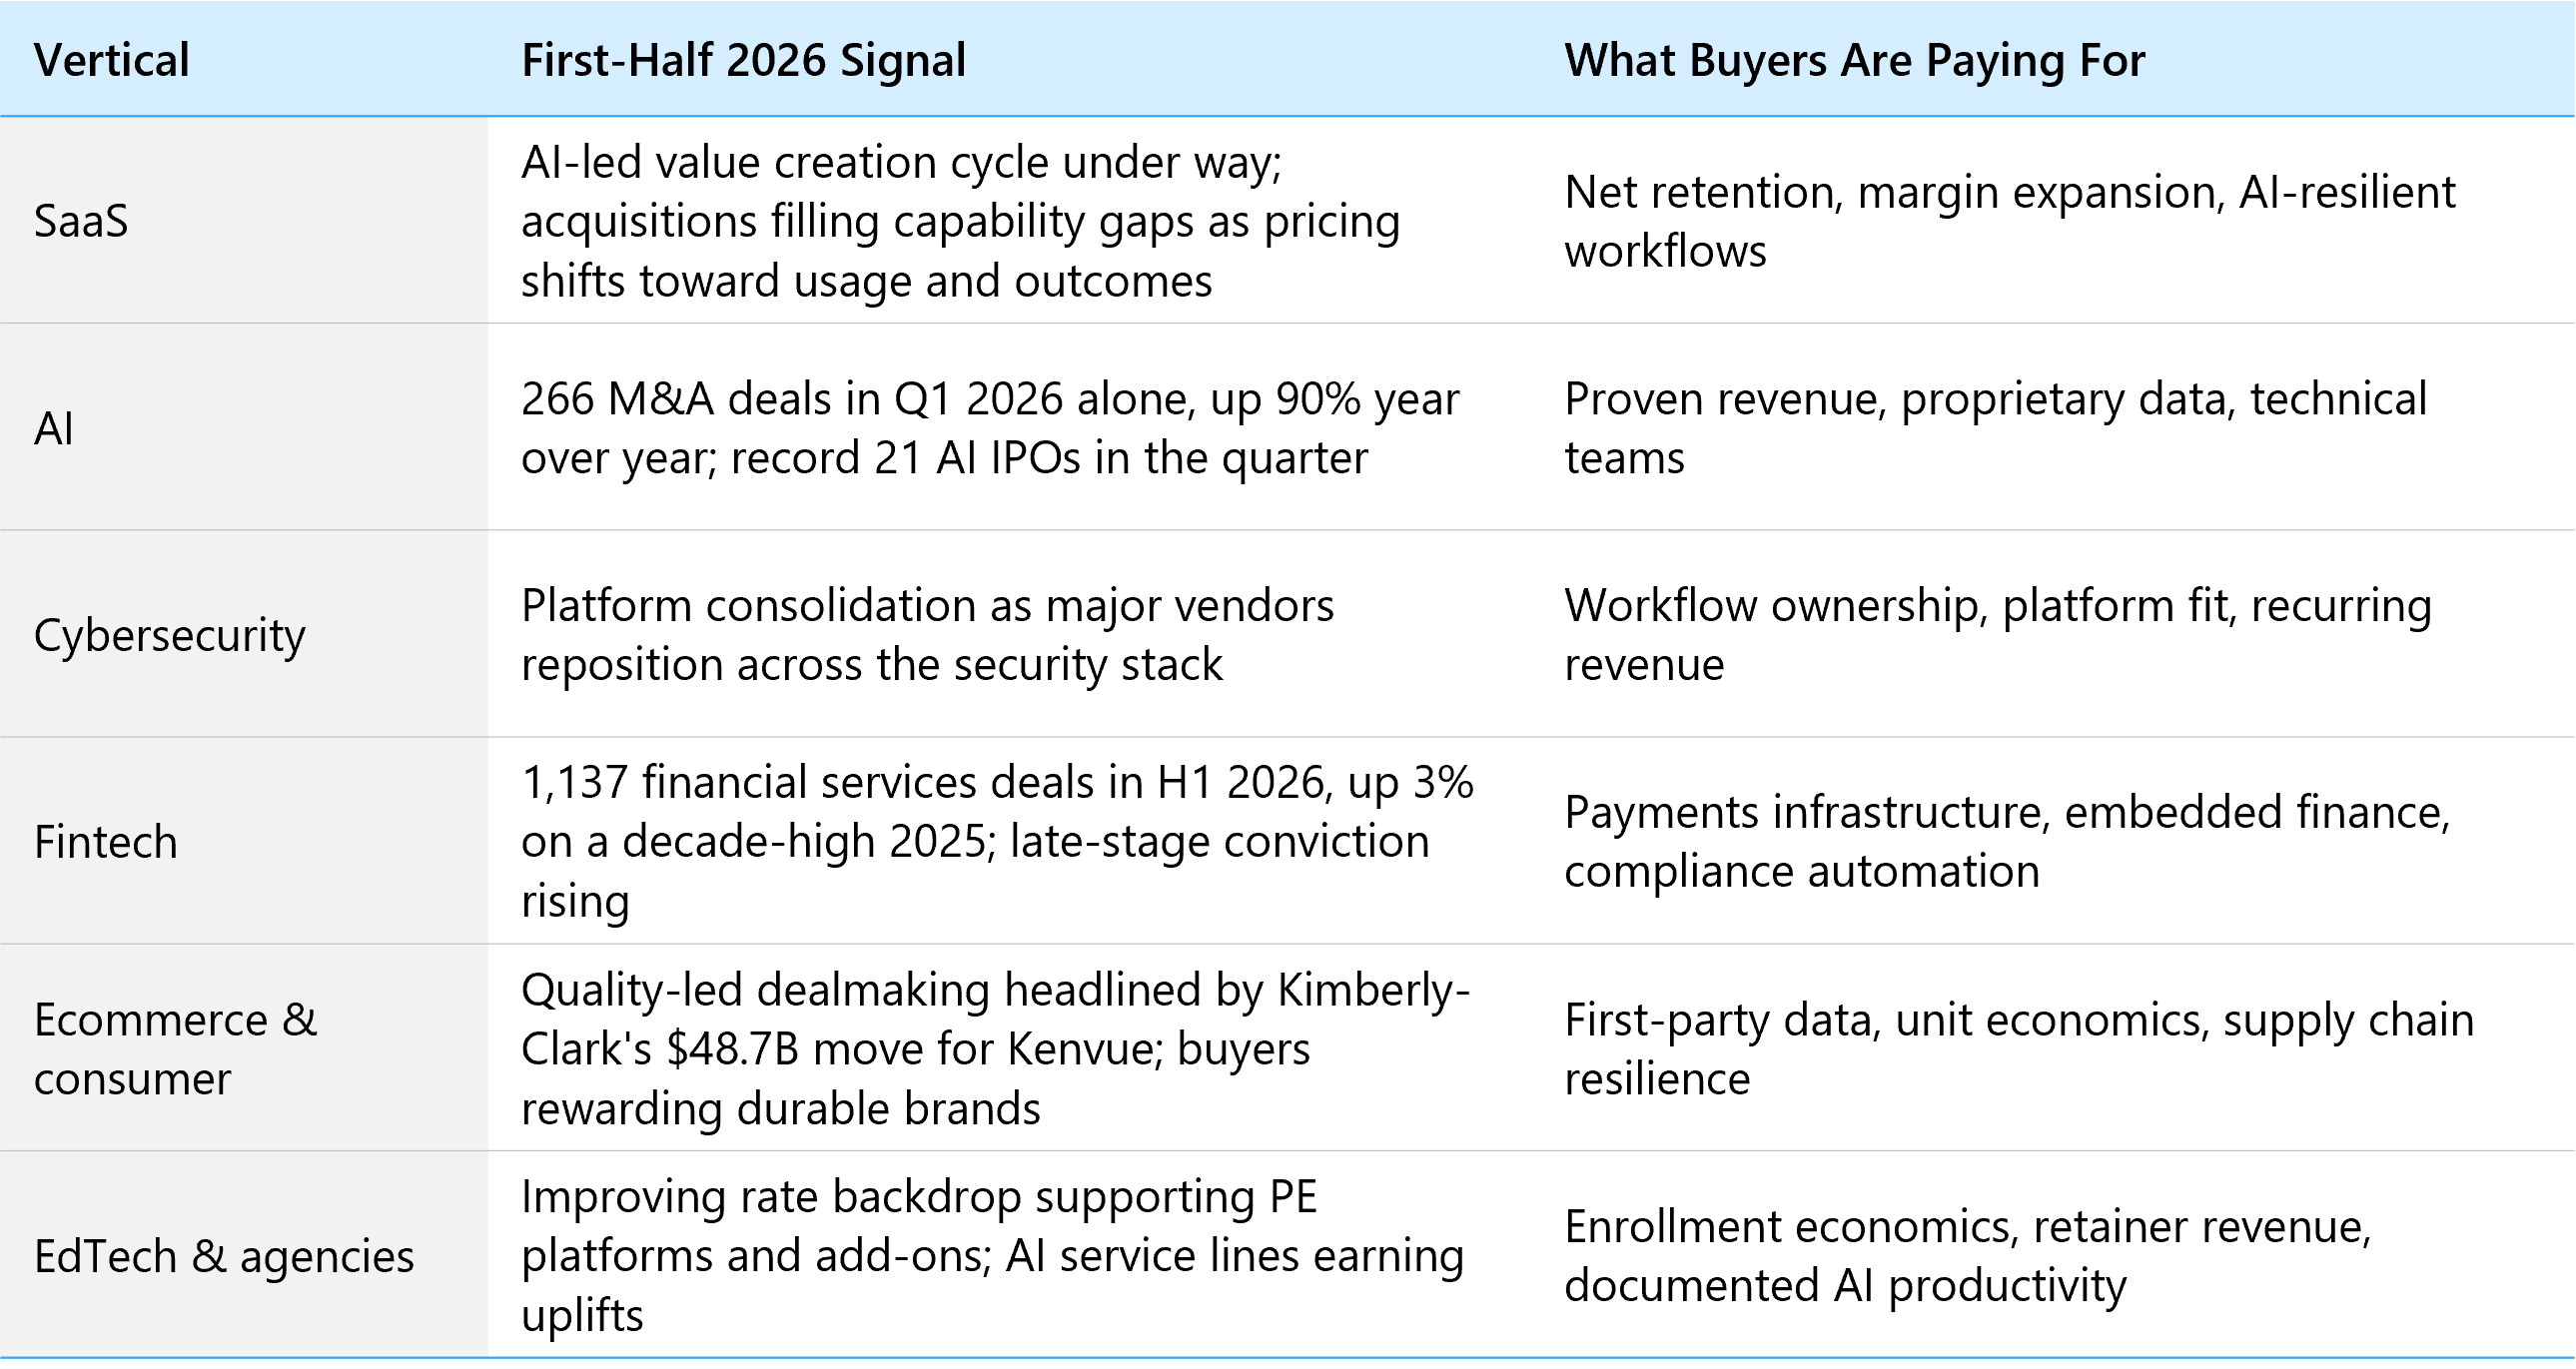
SaaS is entering an AI-led value creation cycle, with acquisitions filling capability gaps as pricing models shift toward usage and outcomes. Activity is forming a barbell: large platform moves at one end, fast capability tuck-ins at the other. Prepared mid-market operators get two distinct buyer conversations instead of one, and the businesses proving AI resilience in their retention data are the ones pulling premium bids.
Cloud and infrastructure software deserve their own line. The data center buildout growing 55.8% this year pulls acquisition demand through the entire stack: cloud security, observability, cost management, data pipelines, and the tooling that makes AI workloads run in production. Businesses that help enterprises deploy, monitor, or economize cloud and AI infrastructure sit in one of the most actively bid corners of the market, and that demand extends from platform-scale targets to focused point solutions.
Cybersecurity remains a consolidation story with strong pricing for platform-relevant assets. M&A is serving as the primary instrument for strategic repositioning as leading vendors redefine their role in the security stack. For founders, platform fit now matters as much as growth rate; our cybersecurity valuation guide covers the metrics that separate premium outcomes from average ones.
Fintech keeps compounding. 1,137 financial services deals were announced in the first half of 2026, up 3% on a decade-high 2025, and capital is concentrating behind fewer companies with more conviction. Marquee transactions like Capital One's completed $5.15 billion acquisition of Brex show incumbents buying their way into spend management and embedded finance. Our fintech M&A outlook maps the buyer pools in detail.
Ecommerce and consumer dealmaking is quality-led, headlined by Kimberly-Clark's $48.7 billion move for Kenvue and steady strategic appetite for durable digital brands. Buyers are rewarding first-party customer data, strong unit economics, and resilient supply chains, and our ecommerce M&A trends report breaks down where DTC and aggregator activity is heading next.
EdTech and agencies round out the picture. An improving rate backdrop is supporting private equity activity at both the platform and add-on level in education technology, covered in our edtech M&A guide. Agencies with named AI service lines and documented productivity gains are commanding valuation uplifts, a dynamic we quantify in our digital marketing agency valuation guide.
Financing Trends and the 2026 Buyer Pool
Private equity enters the second half with $1.3 trillion in buyout dry powder, much of it raised in 2022 and 2023 vintages that now need deployment. That pressure works in sellers' favor: GPs must put money to work, and quality technology assets with durable cash flow sit at the top of most mandates.
Financing is not a constraint either. Investment-grade debt issuance ran at record first-half levels, credit access keeps improving, and the multi-year rebound is being helped along by greater policy certainty, lower rates, and an IPO revival. Better deal math brings more buyers to every process, and structure flexibility adds fuel: earnouts, seller financing, and equity rollovers let both sides bridge remaining valuation gaps and share upside, which converts more conversations into closings.
Sentiment data points the same direction. Sixty percent of global dealmakers expect M&A and financing activity to increase over the next six months, and 29% anticipate working on transactions above $10 billion in the second half of 2026. Confidence is broadening from megadeal boards to mid-market operators.
The buyer pool itself has widened. Strategic acquirers dominate value, private equity dominates process competition, and a deep base of individual and first-time buyers is active at the smaller end of the market. For businesses under $1 million, that end is unusually liquid right now: FE International's M&A Platform connects vetted buyers and sellers directly, with verified financials and structured processes, while our advisory team runs full sell-side mandates for larger companies. The two channels work together, matching each business to the process its size and profile deserve.
Cross-Border Tech M&A and Emerging Markets
International dealmaking posted its strongest start since 2018. Cross-border transactions reached $893 billion in the first half, up 62% from a year earlier, with the United States the most-targeted market at roughly a quarter of activity and the United Kingdom close behind.
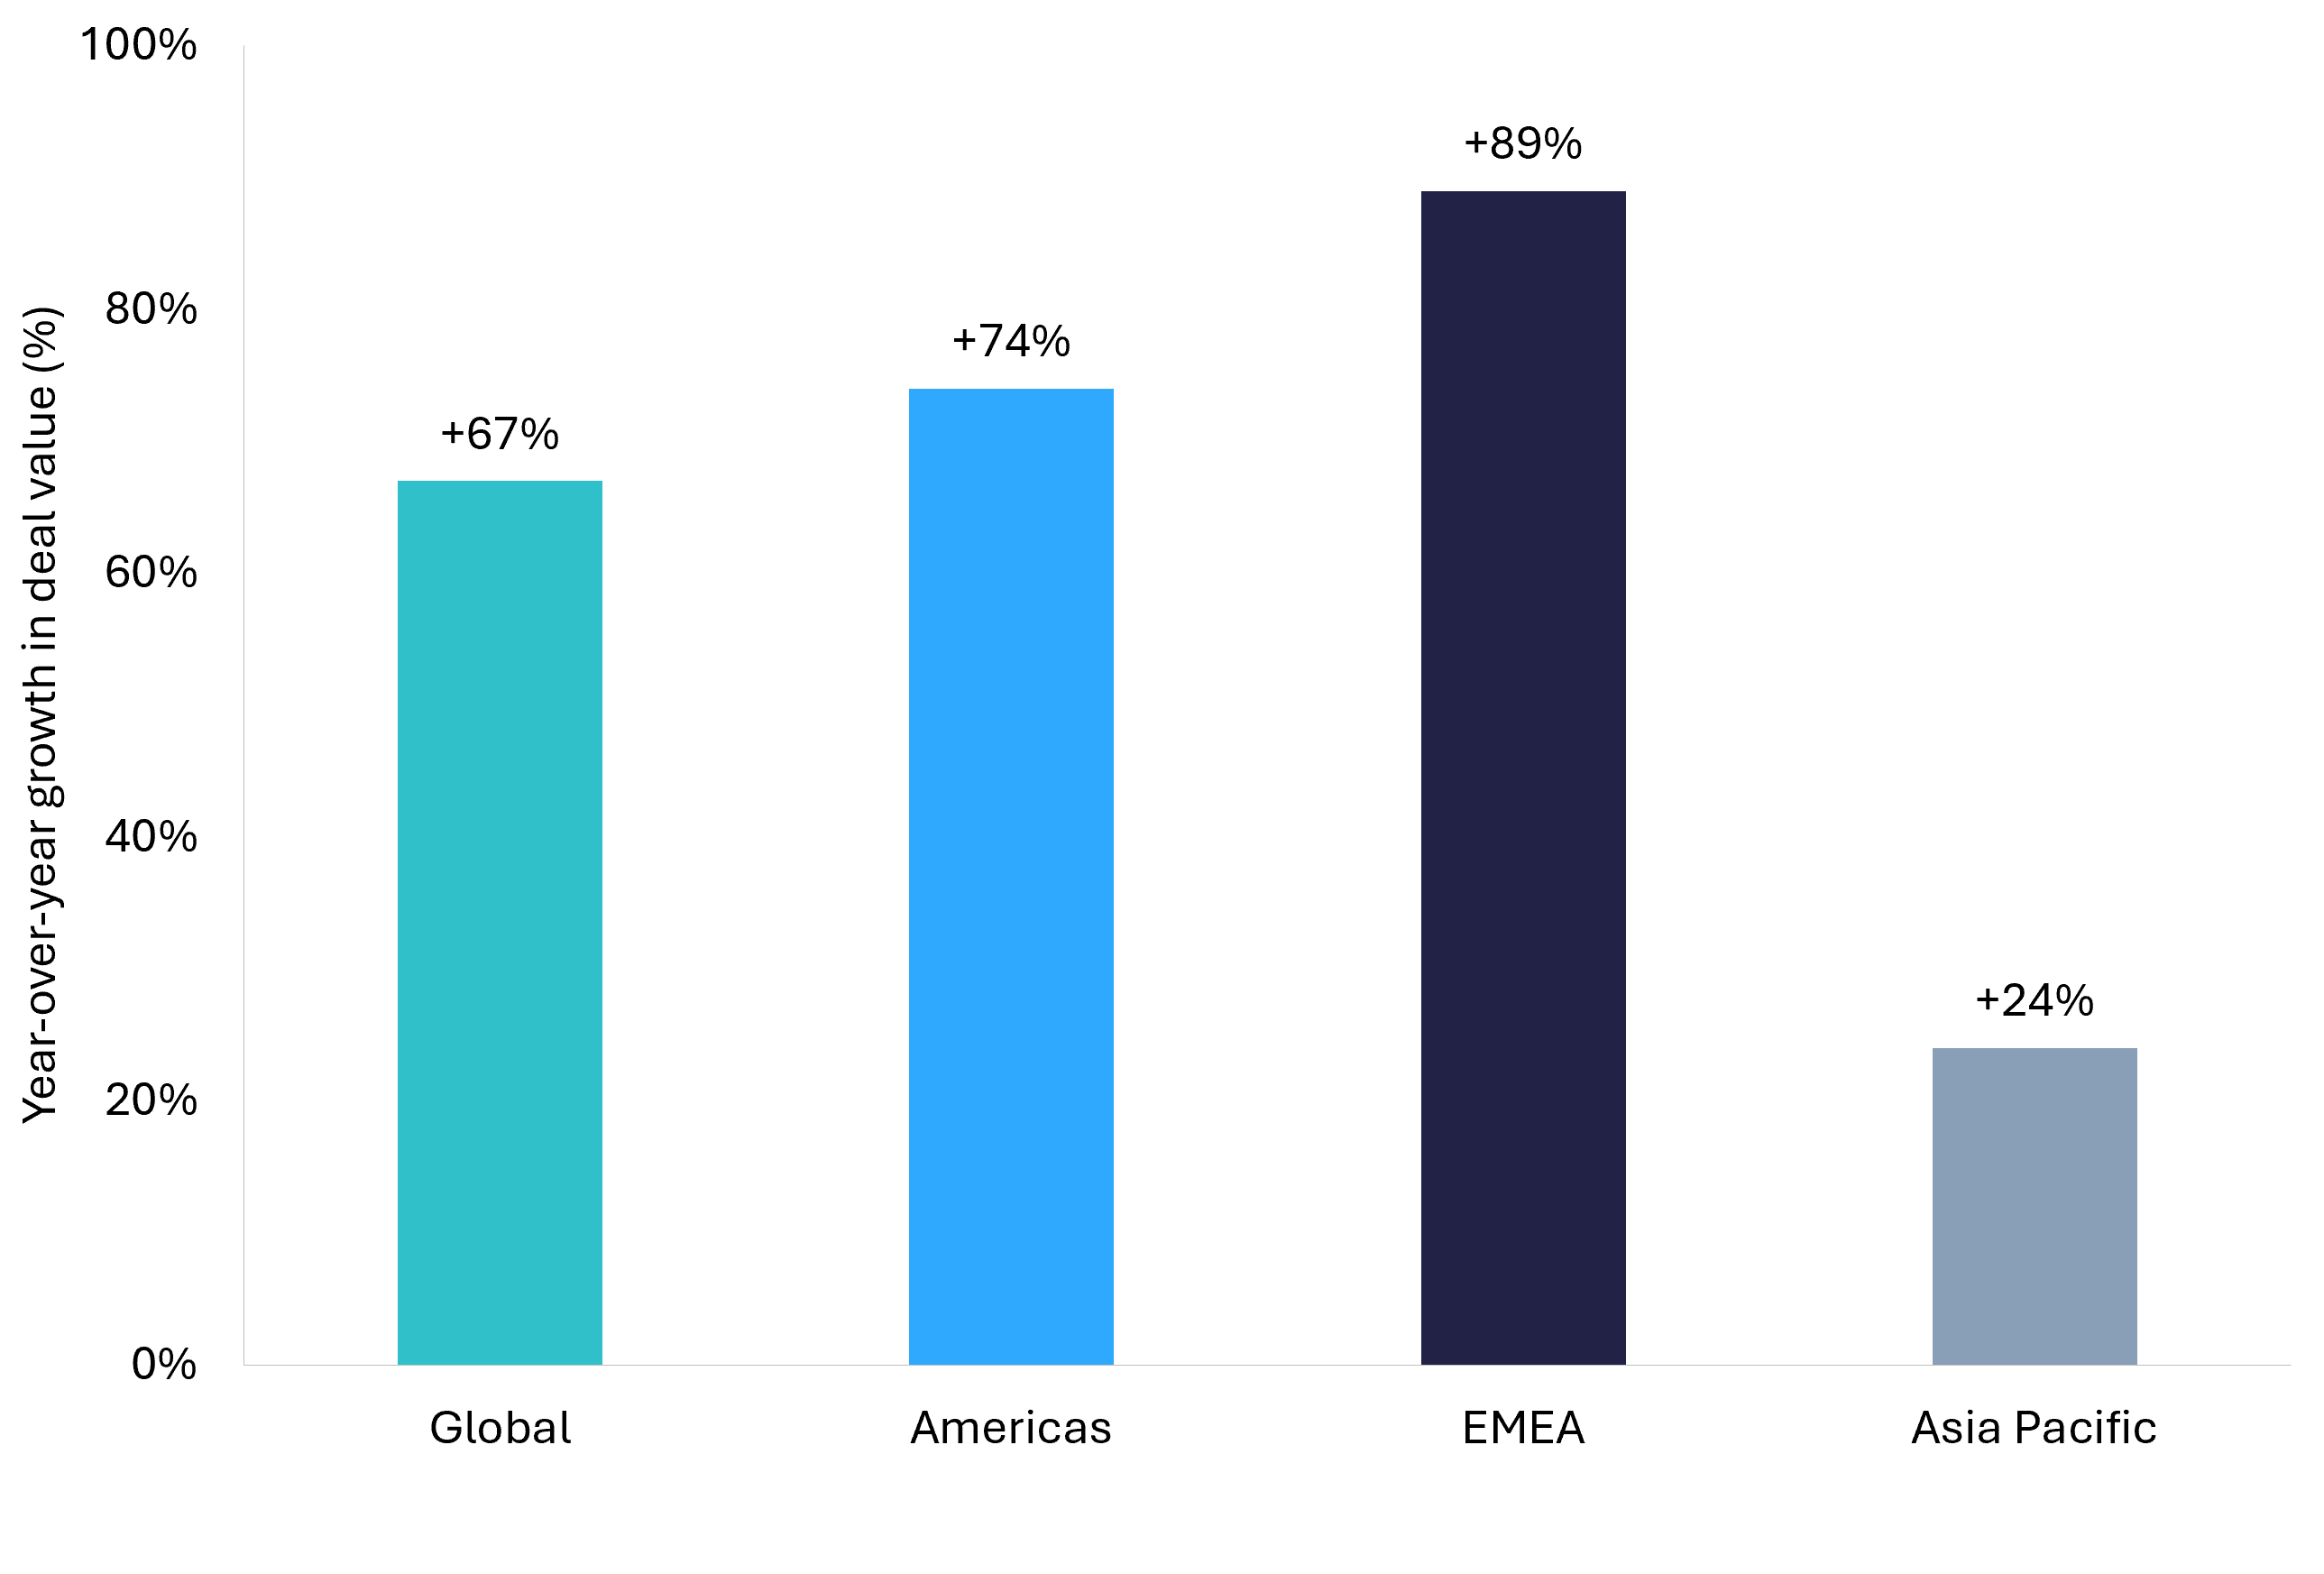
Regionally, technology deal value grew strongly through May: up 74% in the Americas, 89% in EMEA, and 24% in Asia Pacific, with Asia Pacific the only region to grow both value and volume. Europe has become a genuine hot spot as companies pursue strategic deals to sharpen their local and global competitiveness, with strategic deal value across Europe, the Middle East, and Africa up 77% through May. Dealmaking momentum in the Middle East corridor keeps building as sovereign and strategic capital looks for technology exposure, while India and Southeast Asia continue to produce acquisition-ready SaaS and ecommerce companies at attractive price points. Buyers searching beyond saturated core markets are finding growth there first.
For sellers, cross-border depth means wider processes and more competitive tension. A SaaS business in Austin or an ecommerce brand in Manchester can credibly run a process that includes North American strategics, European consolidators, and Asia-Pacific buyers hunting growth. Global buyer reach is precisely where an experienced advisor earns its fee, and it is why FE International maintains active buyer relationships across every major market.
What the Second Half of 2026 Looks Like
The setup for the second half is constructive on nearly every axis. Global deal value is on track to reach $4 trillion for the full year, which would make 2026 the strongest year since 2021. Sentiment is rising, megadeal pipelines are deep, and financing supports transactions at every size.
The IPO calendar could be the sleeper story. SpaceX's public debut has become the largest listing ever, and Anthropic and OpenAI have both confidentially filed for IPOs. Successful listings reset valuation benchmarks upward, return liquidity to venture-backed technology at scale, and historically pull private M&A pricing with them. Every successful listing gives acquirers fresh public comps to underwrite against and gives sellers a stronger negotiating anchor.
Three tailwinds are worth watching. First, an easier regulatory backdrop is letting boards pursue combinations they had shelved, and cross-border approvals are moving. Second, capital keeps rotating toward AI infrastructure, digital platforms with defensible data, and the companies that help enterprises operationalize AI. Third, discipline is paying: dealmakers who define a clear AI thesis before launching a process are moving faster and pricing smarter. The window to acquire quality assets at rational valuations is open, and in the most competitive niches it rewards buyers who move decisively.
Due Diligence, Integration, and the Regulatory Picture
Diligence in 2026 is deeper and faster at the same time. Buyers now examine AI claims line by line: which models a product depends on, who owns the training data, what happens to margins as usage scales, and how defensible the workflow is against the next model release. Security posture, data rights, and revenue quality get the same treatment. Because AI-assisted review compresses timelines, sellers face fewer months of diligence but more pointed questions per week, and the businesses that answer with documentation rather than assurances protect their price.
Integration is where acquirers earn or lose their thesis, and disciplined buyers treat integration as a rare chance to reshape the operating model rather than a cleanup exercise. For sellers, the mirror image applies: transferability lowers perceived integration risk, and lower perceived risk shows up directly in price and terms. Documented processes, a team that stays, and customer relationships that survive the founder's exit are integration insurance that buyers pay for. Talent retention deserves specific attention, since acquirers increasingly structure deals to keep the people who built the product.
The regulatory picture, meanwhile, has shifted from headwind to tailwind. An easier approval environment in the United States is a major reason boards are pursuing large combinations again, and cross-border processes are clearing at a pace not seen in years. Antitrust review still shapes how the biggest platform deals get structured, and AI and data transactions attract national security screening in several jurisdictions, so cross-border sellers should plan filings early. For the overwhelming majority of middle-market technology deals, though, regulation in 2026 is a process item rather than an obstacle.
How Founders Should Position Before Year End
Preparation is the multiple. Buyers using AI-accelerated diligence move faster and dig deeper, so sellers should have 24 to 36 months of clean, normalized monthly financials, a quality of earnings review commissioned early, and documentation behind every AI claim in the deck. Every week saved in diligence is negotiating strength preserved.
A practical 90-day sequence looks like this. Month one: normalize the financials, separate owner expenses, and start closing the books monthly. Month two: commission the quality of earnings review and assemble the data room, including contracts, IP assignments, churn cohorts, and security documentation. Month three: get a professional valuation, agree the target buyer profile, and choose the channel that fits your size. Businesses that complete that sequence enter the market in control of their own process, and control is what converts buyer interest into premium offers.
Timing favors action over waiting. Buyer demand is deep, financing is available, and competitive processes are producing premium outcomes for prepared businesses across SaaS, ecommerce, AI, cybersecurity, edtech, fintech, agencies, and marketplace apps.
The right process depends on size. For technology businesses valued above roughly $1 million, FE International's full advisory service runs the complete sell-side process: valuation, positioning, a competitive buyer process drawn from more than 80,000 pre-vetted investors, and negotiation through close, with a 94.1% success rate across 1,500+ completed transactions. For businesses under $1 million, the M&A Platform offers a faster, streamlined path with the same quality bar: vetted listings, verified buyers, and structured deal flow, built for both sellers seeking liquidity and buyers hunting their next acquisition. Neither channel replaces the other. They are two doors into the same market, sized to fit.
Wherever your business sits, the starting point is the same: know what it is worth today. FE International provides a free, confidential valuation with no obligation, benchmarked against real transaction data from our own closed deals.
The Bottom Line on Tech M&A at Mid-Year 2026
Every tech M&A mid-year 2026 report reduces to one question: does the second half favor action? The data says yes. Record first-half deal value, the deepest buyer pool in years, normalized valuation benchmarks, expanding margins, and financing that supports deals at every size. The verticals differ in texture, from SaaS margin expansion to cybersecurity platform consolidation to fintech's late-stage conviction, but they agree on one theme: prepared, AI-capable businesses are transacting at strong prices. Sellers who prepare now will meet motivated buyers in the second half. Buyers who move decisively will still find quality assets at rational prices, from platform-scale acquisitions to sub-$1 million opportunities on our M&A Platform.
FE International, the global market leader in middle-market technology mergers and acquisitions, has completed more than 1,500 transactions with a 94.1% success rate across SaaS, ecommerce, AI, cybersecurity, edtech, fintech, agencies, and marketplace apps. If you are weighing an exit, an acquisition, or simply want to know where you stand, get a free valuation today. It is confidential, data-backed, and obligation-free, and it is the first step toward making the second half of 2026 your transaction window.