


In February 2026, eBay agreed to pay approximately $1.2 billion in cash for Depop, a mobile-first fashion marketplace running roughly $1 billion in annual gross merchandise sales. Do the arithmetic and the headline number resolves to about 1.2 times gross volume. That single ratio tells you more about marketplace app valuation in 2026 than any rule of thumb, because it shows what buyers are really pricing: not the money flowing across the platform, but the share of it the platform keeps and the durability of the demand behind it.
Marketplace app valuation is harder than it looks, and the reason is definitional. The term covers three genuinely different businesses. A Shopify checkout tool earning subscription revenue is priced one way. A two-sided platform matching buyers and sellers is priced another. A consumer mobile app monetizing through in-app purchases is priced a third. Apply the wrong method and you can be out by a factor of two.
This guide sets out how buyers price each of the three in 2026 using real numbers: take rates calculated from Q1 2026 filings, multiple ranges from FE International transaction data across more than 1,500 closed deals, and derived multiples from disclosed 2026 acquisitions. FE International advises founders across the marketplace apps sector, and the patterns below come from that deal work.
1. What Counts as a Marketplace App, and Why the Category Sets Your Method
Three business models get filed under the same label. Each has a different revenue shape, a different risk profile, and a different valuation method. Getting the classification right is the first decision in any valuation, and it is the one owners most often get wrong.
Platform-ecosystem apps
These are applications distributed inside somebody else's platform: a Shopify checkout tool, a Salesforce mapping extension, an AWS storage plugin, a WordPress add-on. The economics resemble software more than commerce. Revenue is usually recurring subscription, gross margins run high, and the customer relationship is mediated by the host platform. Buyers value these on earnings or on annual recurring revenue, and the central diligence question is platform dependency. If the host can replicate your feature natively, your multiple reflects that risk.
Two-sided marketplace platforms
These match independent supply with independent demand and monetize the transaction: a vertical marketplace for equipment rental, a services platform connecting tradespeople with homeowners, a recommerce app for a specific product category. Revenue is a take rate applied to gross merchandise value. Buyers underwrite liquidity, match rate, and repeat behaviour on both sides. Gross volume is context; the take rate and the profit on it are the valuation inputs.
Consumer mobile apps with in-app monetization
These earn through subscriptions, in-app purchases, or advertising: a fitness tracker, a photo editor, a casual game, a language tutor. Revenue quality varies enormously by monetization model, and so do multiples. Buyers examine retention curves, cohort payback, and the concentration of revenue among paying users. For a fuller treatment of this model specifically, our guide to building, valuing and selling an app covers the operational detail.
The model determines the metric, the metric determines the multiple. Classify the business before you price it.
Plenty of businesses sit across two categories. A Shopify app that also runs a supplier directory has both subscription revenue and marketplace dynamics. In those cases buyers value the segments separately and blend, weighting toward whichever stream carries the durable margin.
2. How Buyers Value Marketplace Apps: SDE, EBITDA, Revenue, and Where Gross Volume Fits
Four methods cover almost every marketplace app transaction. Which one applies depends on size, profitability, and growth rate rather than on preference.
Seller's discretionary earnings, for owner-operated businesses
Seller's discretionary earnings, or SDE, is net profit with owner compensation and discretionary or one-time costs added back. It is the standard measure for owner-operated businesses valued under roughly $5 million, and the add-back schedule is where value is won or lost. A founder salary, personal travel booked through the business and a one-off legal bill are all legitimately added back. Undocumented add-backs are not, and a buyer who finds one starts discounting the rest.
EBITDA, for professionally managed businesses
Once a business runs without the founder in daily operations and clears roughly $5 million in revenue, buyers switch to earnings before interest, taxes, depreciation and amortization. EBITDA assumes a management team is already paid for inside the cost base, which means the buyer is acquiring a system rather than a job. That reframing is usually worth a full turn on the multiple by itself.
Revenue and ARR multiples, for high-growth businesses
When growth is fast enough that current profit understates the asset, buyers price on revenue. The threshold in practice is growth above roughly 20% a year with gross margins above 70%. Below that, revenue multiples get argued down toward earnings-based valuations quickly.
Gross volume multiples, and why they are small
Gross merchandise value multiples get quoted often and misunderstood constantly. The reason they look small is straightforward: very little of gross volume ever reaches the bottom line. DoorDash reported adjusted EBITDA at 2.4% of Marketplace gross order value in Q1 2026 on $31.6 billion of volume. Uber reported non-GAAP operating income at 3.5% of gross bookings on $53.7 billion. At those conversion rates, a 1x gross volume multiple implies something like 30 to 40 times operating profit. Gross volume is a scale indicator. It is not an earnings proxy.

A worked calculation
Take a two-sided marketplace app processing $14 million in annual gross merchandise value at a 9% take rate. Revenue is $1.26 million. Strip out payment processing, hosting, support and paid acquisition and adjusted earnings come to $420,000. The owner draws a $95,000 salary and the business absorbed $30,000 of non-recurring legal and platform migration cost. SDE is therefore $545,000.
At the ranges in Section 3, thin liquidity and flat growth prices around 2.5x to 4.0x, or $1.36 million to $2.18 million. The same earnings with strong two-sided liquidity, 25% growth and low owner dependency reaches 4.5x to 8.0x, or $2.45 million to $4.36 million. Identical profit, roughly triple the outcome. Sections 4 through 7 explain which end you land on.
3. Multiple Benchmarks by Marketplace App Type in 2026
The ranges below come from FE International transaction data. They describe adjusted earnings multiples for lower and middle market deals, which is where the great majority of marketplace app transactions happen. Public company multiples run substantially higher and are not a useful benchmark for a privately held app.

Three patterns are worth drawing out. Revenue model beats category: a subscription mobile app with genuine retention prices above a two-sided marketplace with weak liquidity, even though the marketplace sounds like the more defensible business. Size compounds within every band, because larger earnings bases attract institutional buyers who pay for scale and pay in cash. And the spread inside each band is wider than the gap between bands, which means execution matters more than sector.
The capital backdrop supports the upper half of these ranges. Bain reported buyout deal value rising 44% to $904 billion in 2025 and exit value climbing 47% to $717 billion, both the second highest totals on record, against $1.3 trillion of buyout dry powder still waiting to be deployed. Sponsors with aging capital and a mandate to spend it are an active audience for profitable, well-documented platform assets.
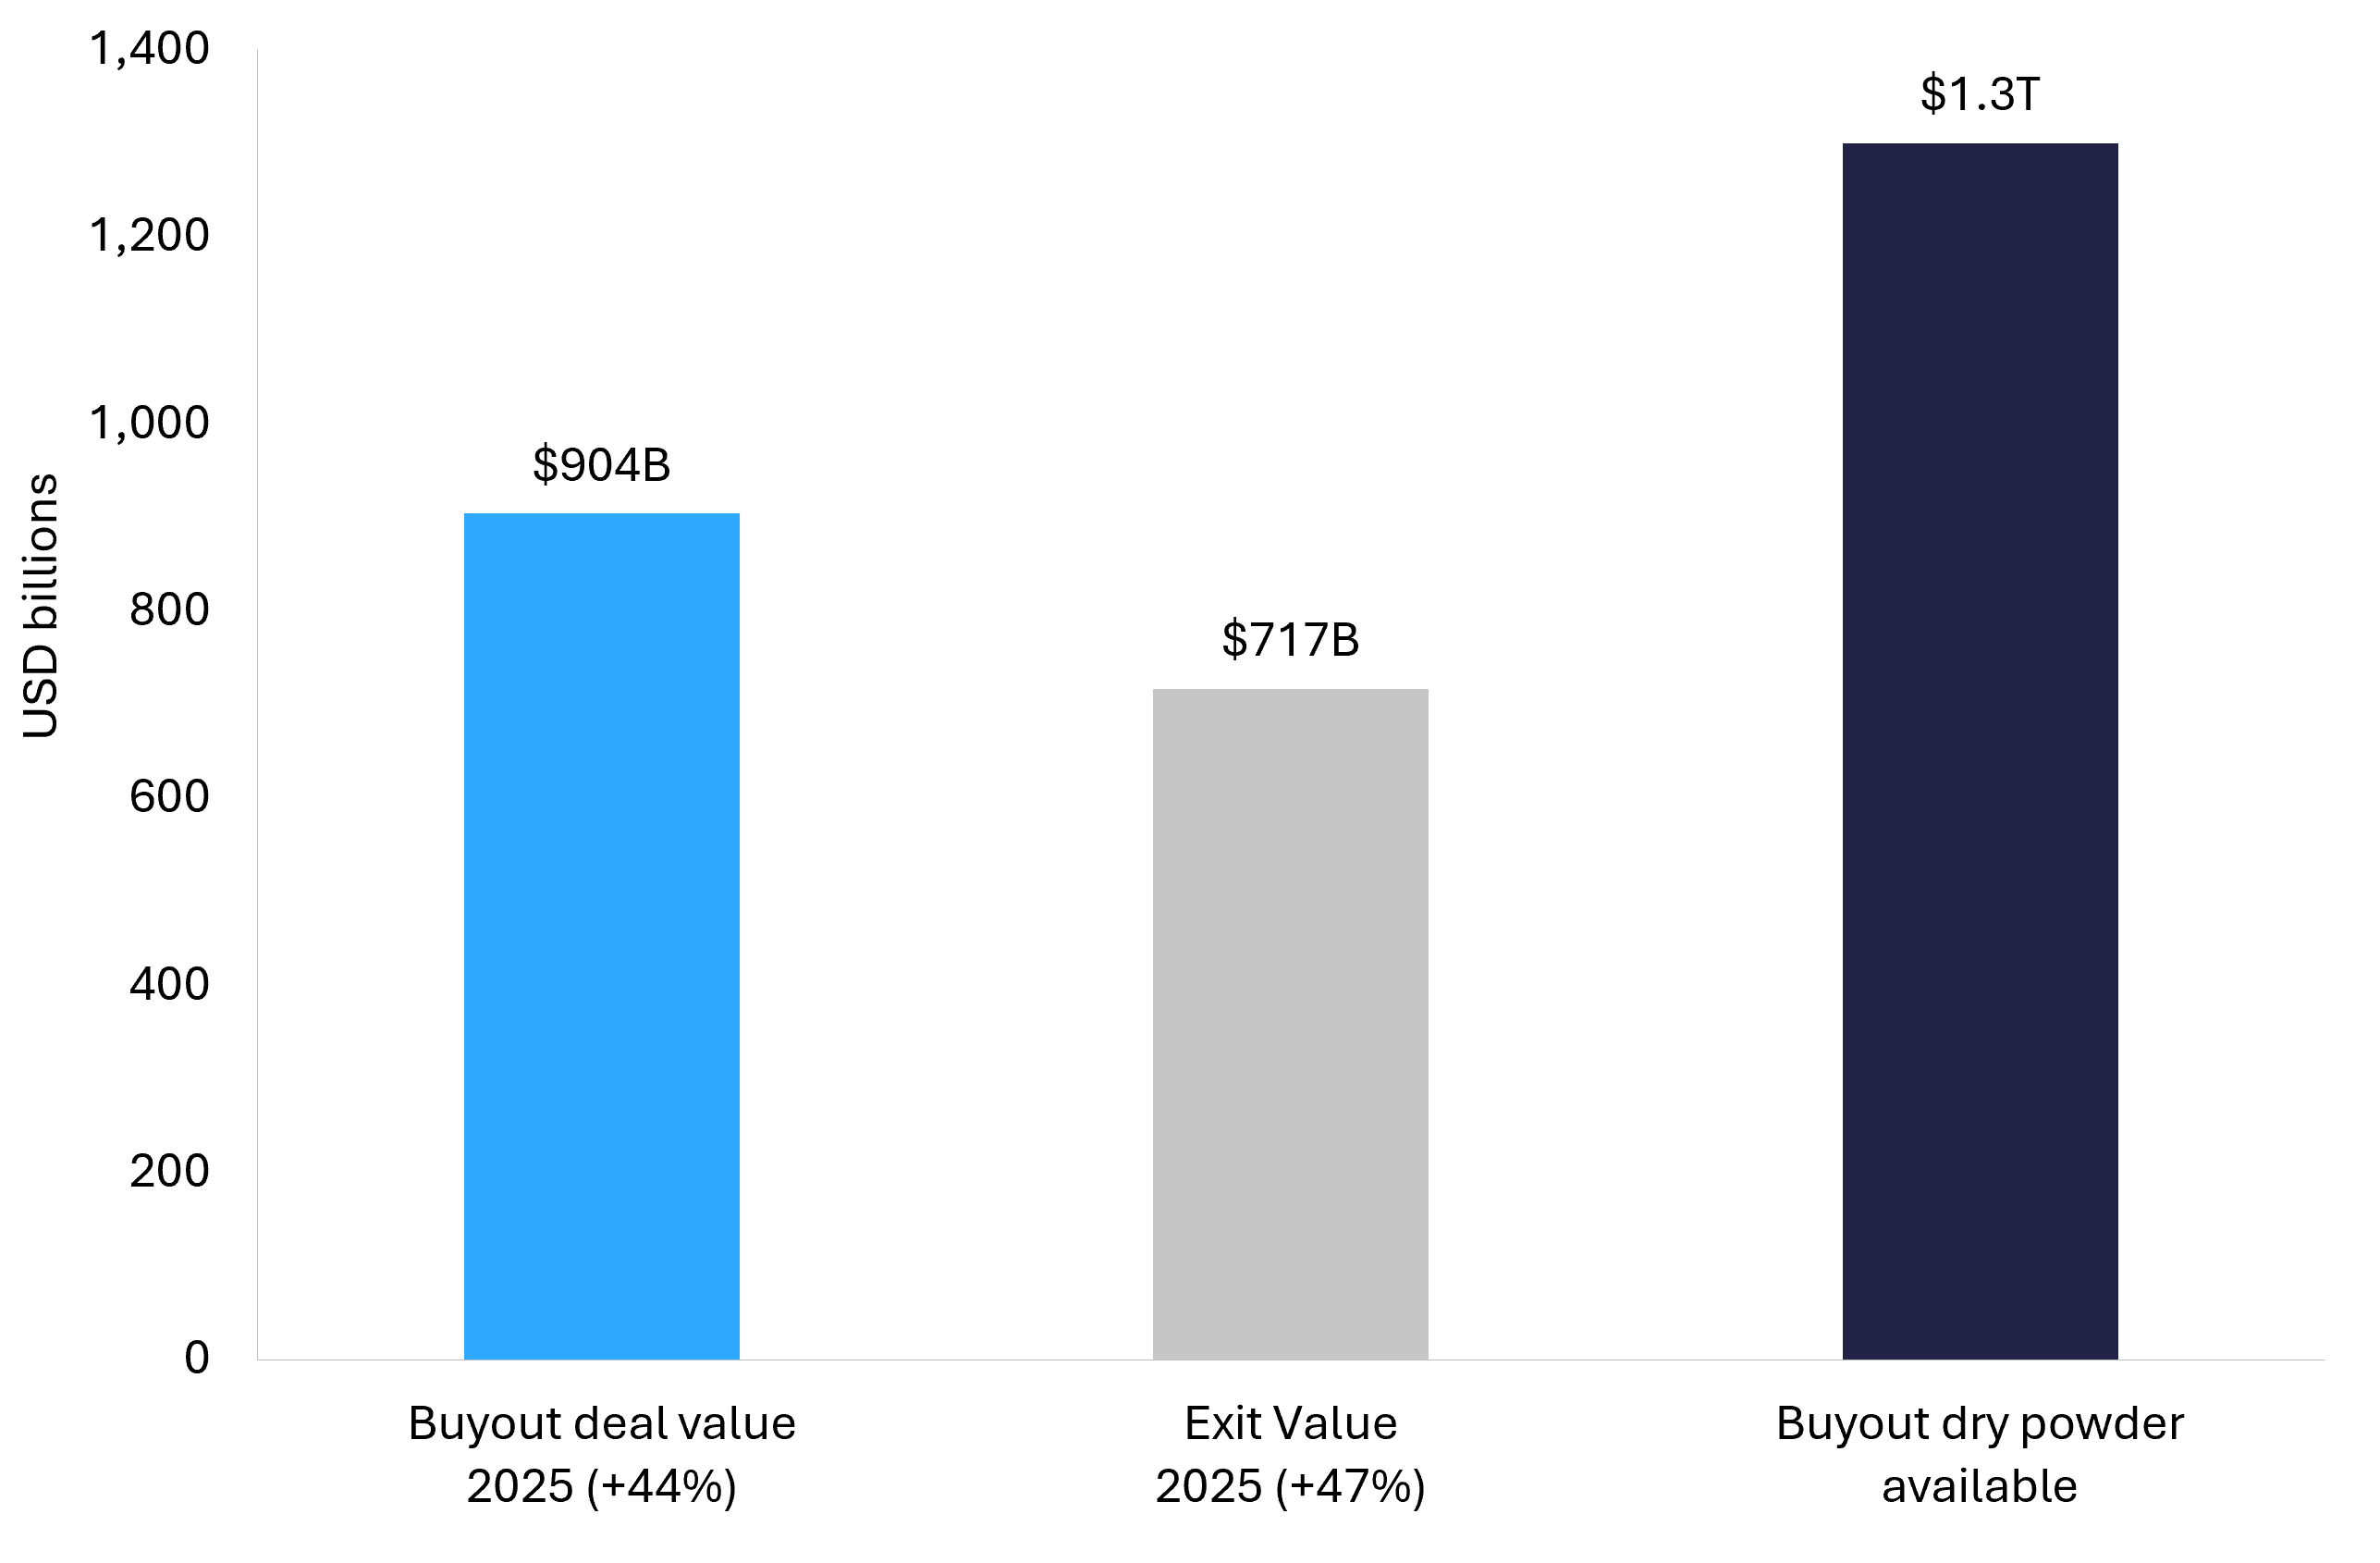
One caveat on headline market figures. PwC has global deal value on track for roughly $4 trillion in 2026, but notes transactions above $5 billion now account for almost half of total global deal value, double their share two years ago. Strip out those megadeals and aggregate value is slightly down. For a marketplace app founder the practical reading is encouraging: capital is abundant and buyers are selective, so preparation separates a competitive process from a quiet one.
4. Take Rate and Gross Volume: The Two Numbers Buyers Check First
Take rate is platform revenue divided by the gross value of transactions flowing through the platform. eBay defines it exactly that way in its filings and treats it as a primary revenue driver, reporting a take rate of 13.91% on $22.2 billion of gross merchandise volume in Q1 2026. It is the single cleanest measure of how much value a platform captures from the activity it enables.
The spread across public marketplaces is wide, and the reason is service depth rather than pricing aggression.

Etsy sits at the top of that range, reporting a take rate of 25.7%, up 180 basis points year over year, with the expansion led by its advertising products and payments rather than by raising the listing fee. Airbnb sits at the bottom near 9%, because high average transaction values allow a lower percentage to produce substantial revenue, reporting $2.7 billion of revenue on gross booking value of $29.2 billion. Neither position is better. They reflect different service intensity.
The distinction most owners miss
There is a difference between the commission a marketplace advertises and the net take rate a buyer will underwrite. DoorDash charges restaurants a headline commission well above 12.8%, yet its reported revenue lands at $4.0 billion on $31.6 billion of Marketplace gross order value. The gap is pass-through: money that moves through the platform and straight out to couriers, merchants, taxes and tips. When you present a marketplace app for sale, present net revenue after pass-through. Presenting the headline commission rate invites a correction in diligence, and corrections in diligence cost multiple turns.
Buyers underwrite the revenue you keep, not the commission you advertise.
Growth quality, engagement, and the metrics behind the take rate
Take rate on its own says nothing about durability. Buyers pair it with a short list of behavioural measures:
- Liquidity and match rate. The share of listings that transact and the share of searches that convert. A marketplace where 70% of listings sell has a functioning market. One where 8% sell has a directory with a payment button.
- Repeat rate on both sides. Buyer repeat purchase and seller repeat listing, measured by cohort. Two-sided repeat behaviour is the closest thing a marketplace has to contracted revenue.
- Growth composition. Volume growth from more users, higher frequency, or higher prices. Frequency growth is valued most because it signals habit. Price-led growth is valued least because it is a lever you can only pull once.
- Retention curves by cohort. For mobile apps, where the curve flattens matters more than where it starts. A flattening curve indicates genuine product fit; a curve still decaying at day 90 indicates acquisition dressed up as growth.
- LTV to CAC by channel. Blended figures hide the problem. Buyers want the ratio channel by channel, because one efficient organic channel subsidising three unprofitable paid ones is a margin risk they will price for.
Uber illustrates why engagement carries valuation weight. Its membership programme reached 50 million members and now drives roughly half of total mobility and delivery gross bookings. Membership converts discretionary transactions into habitual ones, which is the quality buyers pay a premium for at any scale.
The mobile channel deserves specific attention in any marketplace valuation. Etsy disclosed that its app accounted for 47% of gross merchandise sales, growing 11.2% year over year against slower growth in the business overall. App users transact more often and cost less to reach a second time. If your app channel is outgrowing your web channel, that belongs in your information memorandum.
5. Network Effects, Liquidity, and What Actually Survives Diligence
Network effects are the most cited and least evidenced claim in marketplace pitch materials. The logic is sound: each additional participant raises platform utility for the other side, acquisition costs fall as density builds, and the position becomes hard to attack. That is exactly why marketplace businesses can command premium multiples.
Experienced buyers test the claim rather than accepting it. Research by Harvard Business School's Andrei Hagiu and Simon Rothman argued that reaching critical mass is not the finish line, identifying several distinct ways marketplaces fail after clearing that hurdle: growing too fast too early, failing to build sufficient trust and safety, using penalties rather than incentives to discourage users from taking transactions off-platform, and ignoring the risk of disintermediation. Two decades later those are still the four questions in every marketplace diligence process.
Disintermediation risk
Disintermediation is the marketplace-specific risk that has no equivalent in software. Users meet on your platform, then transact directly and cut you out. In services and B2B marketplaces it is the largest single threat to the revenue line. Buyers quantify it by examining the ratio of first transactions to repeat transactions per matched pair. If a supplier and a customer transact once on the platform and never again while the relationship demonstrably continues, value is leaking. Platforms that solve this with genuine embedded utility, such as payments, scheduling, insurance, dispute resolution or compliance tooling, defend their take rate. Platforms that solve it with contractual penalties do not.
Multi-homing and switching costs
If your suppliers list on three competing platforms at no cost, your supply-side position is weaker than your listing count suggests. Buyers look for evidence of switching cost: inventory management that lives on your platform, ratings that do not travel, integrations that would need rebuilding. Where supply is commoditised, network effects tend to plateau once basic liquidity is reached, and the multiple reflects that ceiling.
Competitive position
Competition affects marketplace app valuation mainly through pricing power. A vertical marketplace that leads a defined niche can raise take rate over time, which is what Etsy has done through advertising and payments. A marketplace competing on commission against two similar platforms cannot, and its multiple rests on volume growth alone. Narrow category leadership is worth more than broad category participation, which is why focused vertical platforms frequently out-price larger generalist ones.
A defensible niche beats a large addressable market. Buyers pay for pricing power, and pricing power comes from being the obvious choice in a specific category.
6. Marketplace App Valuation Compared With SaaS App Valuation
This comparison comes up in nearly every marketplace app engagement, usually because the founder has read SaaS valuation benchmarks and is trying to apply them. The methods overlap but the inputs do not.

The practical consequence is that a marketplace app needs more evidence to earn the same multiple as a SaaS app of equivalent size. Contracted revenue is visible in a contract; marketplace durability has to be proved through cohort data. Founders who arrive with 24 months of cohort exports, match-rate history and repeat-purchase curves close at the top of the range. Founders who arrive with a revenue chart do not.
B2B compared with B2C marketplace apps
The B2B and B2C split produces a real valuation difference, and it runs in both directions depending on which factor dominates.
- B2B marketplaces carry higher average transaction values, longer relationships, more predictable reordering, and often contracted or invoiced terms. Those characteristics support higher multiples. They also concentrate revenue: a wholesale platform where 15 buyers drive 60% of volume has a concentration problem that will be priced.
- B2C marketplaces have naturally diversified revenue and faster transaction cycles, which buyers like. They carry higher churn, thinner order values, more exposure to paid acquisition cost inflation, and greater sensitivity to consumer sentiment.
In practice buyers do not apply a B2B or B2C premium as such. They apply a concentration discount and a predictability premium, and the two labels simply predict which one is likely to bite. A B2B marketplace with 400 active buyers and no customer above 5% of volume is valued as a predictable business without the concentration penalty, and that is the strongest position available in the category.
7. The Value Drivers That Move Your Multiple
Two marketplace apps with identical earnings routinely sell for very different amounts. The table below sets out what separates them, drawn from what buyers actually reward and penalise in live processes.
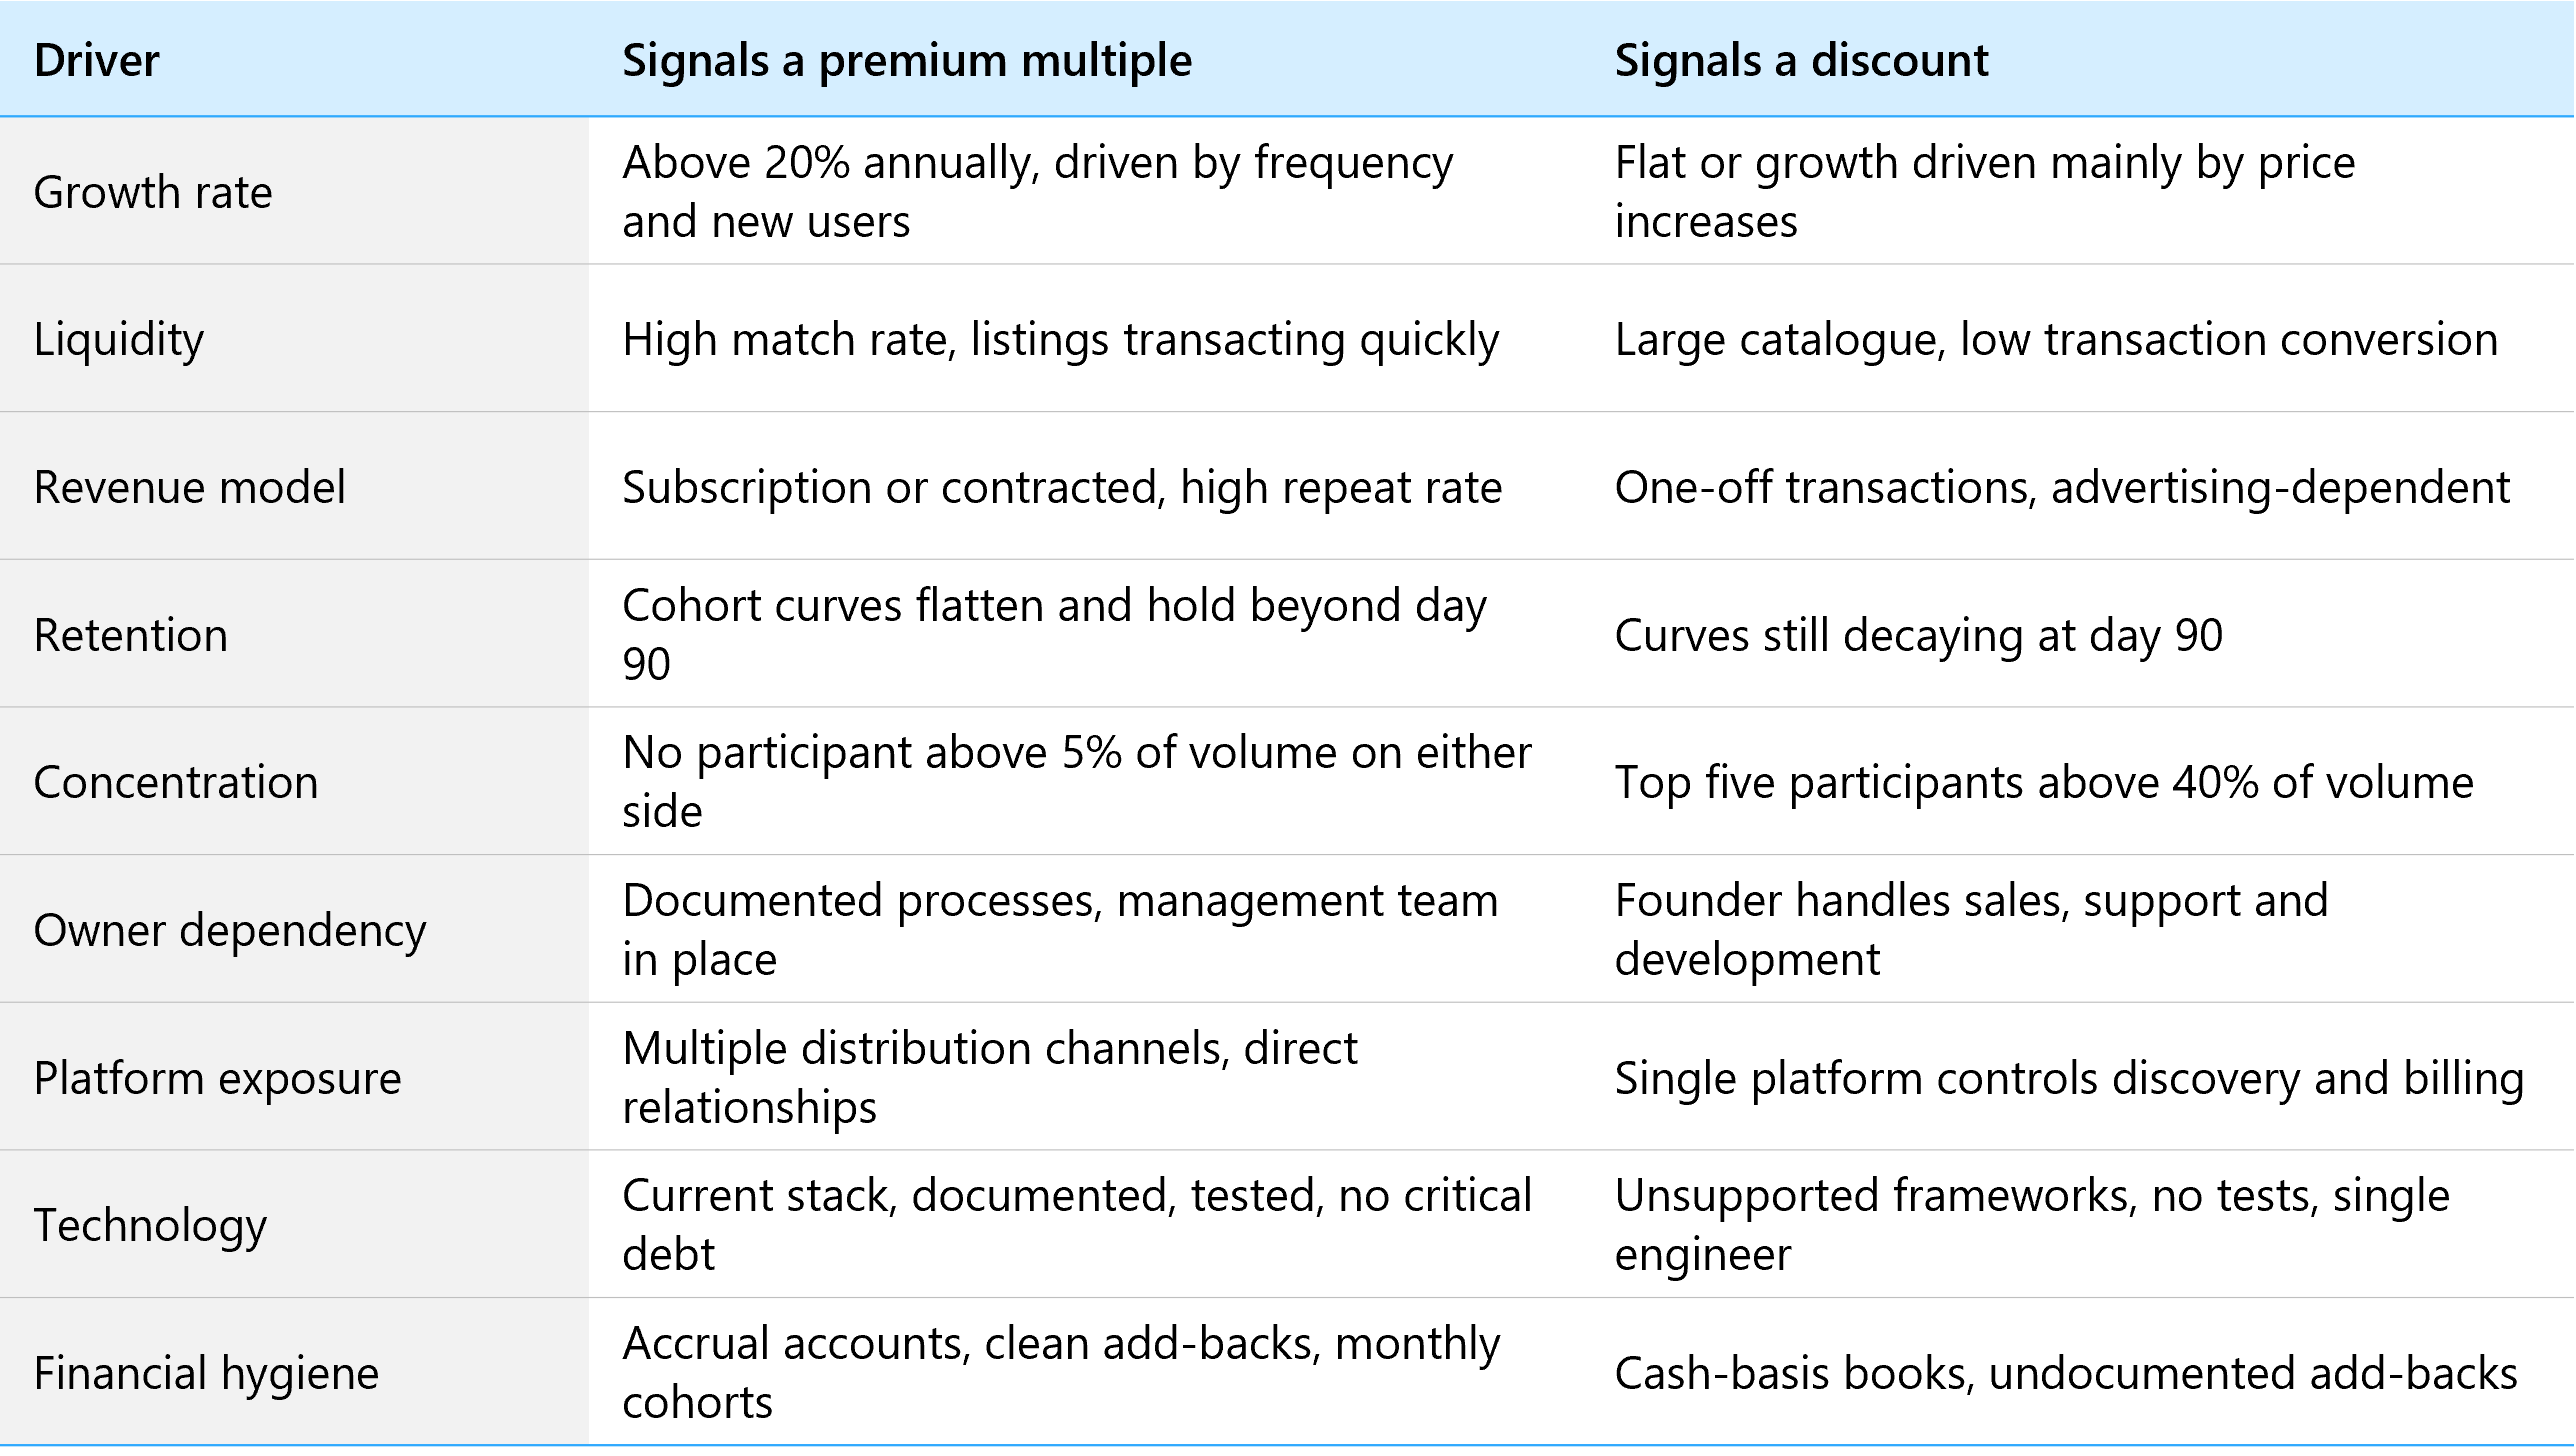
Growth is the driver doing the most work in 2026
Bain's framing for the current cycle is that 12 is the new 5: where private equity deals once needed roughly 5% annual earnings growth to generate acceptable returns, today's entry multiples and financing costs require closer to 12%. That mathematics passes straight through to what a sponsor can pay you. A marketplace app growing 25% a year lets a buyer hit return targets without heroic assumptions. One growing 4% requires the buyer to find the growth themselves, and they will price that work into the offer.
Why technology stack shows up in the price
Technology diligence affects marketplace app valuation through cost of ownership rather than elegance. Buyers price the investment needed to keep the asset running and shippable. An app on a current, documented, tested stack with more than one engineer who understands it needs no remediation budget. An app on an unsupported framework with no test coverage and one contractor holding the knowledge needs a rebuild reserve, and that reserve comes out of your price or lands in escrow. Buyers also examine whether matching, pricing and trust logic is genuinely proprietary or a thin layer over third-party services, because that determines what they are actually acquiring.
The artificial intelligence nuance
Adding AI features does not automatically raise a multiple, and 2026 data explains why. RevenueCat's analysis of subscription app performance found that AI-powered apps generate 41% more revenue per customer but see users churn roughly 30% faster. Higher revenue with worse retention is a weaker asset than the revenue line suggests, and buyers have learned to check. PwC found a parallel discipline among corporate acquirers: AI featured in the strategic rationale for roughly a third of the largest deals in 2025 but only 17% in the first half of 2026, as buyers became more selective about where the technology creates durable demand. AI that measurably improves retention or match quality earns a premium. AI as a feature announcement does not.
The dispersion in that same dataset is instructive on its own. RevenueCat reported the median subscription app growing monthly recurring revenue 5.3% year over year while top-decile apps grew more than 306%. That gap is the multiple spread in Chart 2, expressed as growth.
8. Platform Fees, Regulation, and Agentic Commerce: The 2026 Repricing
Three structural changes landed in 2026 that alter marketplace and app economics directly. Buyers are diligencing all three. Most valuation content published on this topic mentions none of them.
App store economics changed on 1 January 2026
Apple confirmed that from 1 January 2026 it would transition from the Core Technology Fee to a Core Technology Commission on digital goods and services for apps distributed in the European Union, applying across the App Store, web distribution and alternative marketplaces. The shift replaces a per-install charge with a commission tied to transaction value. For an app business, that changes the shape of the cost line: a fee that used to scale with downloads now scales with revenue.
Other jurisdictions are moving the same way at different speeds. Japan's Mobile Software Competition Act took effect in December 2025, opening alternative marketplaces and third-party payment routes. Apple reduced commissions on its China mainland storefront from March 2026, moving qualifying Small Business Program and Mini Apps transactions to 12%. In the United States, external payment links have been permitted since the Epic ruling, with the definition of a reasonable fee remanded to the district court in 2026.
The valuation consequence is specific. A subscription app that has re-architected billing to route eligible transactions through lower-cost paths carries a structurally better margin than an identical app paying standard commission on everything, and that difference flows into earnings and therefore into price. Buyers now ask which routes an app uses, in which jurisdictions, and how much revenue is exposed to a single commission schedule.
Platform fee structure is now a margin variable, not a fixed cost of doing business. Buyers price the difference.
Labour marketplaces face a hard deadline in December 2026
Any marketplace app that organises work performed by individuals in the European Union is affected by Directive (EU) 2024/2831 on improving working conditions in platform work. Member states must transpose it into national law by 2 December 2026. The directive introduces a legal presumption of employment where the facts indicate control and direction, shifting the burden of proof onto the platform, and it regulates automated monitoring and decision-making systems including a right to human review of consequential decisions. Penalties for the data protection provisions are set at General Data Protection Regulation levels, reaching 20 million euros or 4% of total worldwide annual turnover.
For services, delivery, freelance and labour marketplaces with any European exposure, this is now a standing diligence item, and the deadline is four months away. The World Bank's work on online gig platforms is a reminder of the scale involved, estimating that between 154 million and 435 million people perform online gig work globally, reaching as much as 12% of the global labour force. Platforms that have already mapped which engagement models sit inside the presumption, and can show the analysis, remove a discount that buyers would otherwise apply by default.
Agentic commerce is now a diligence question
McKinsey has projected that agentic commerce, where AI agents discover, compare and complete purchases on a consumer's behalf, could generate $3 trillion to $5 trillion of orchestrated revenue globally by 2030, noting that marketplaces alongside brands, logistics providers and payments players will all need to adapt. The relevance to valuation is about discovery. Marketplaces whose demand arrives through search or app store browsing depend on human discovery behaviour. If a meaningful share of that discovery moves to agents, platforms with structured, machine-readable inventory and clean APIs stay visible and platforms without them do not.
This is not yet moving multiples materially in the lower and middle market. It is moving conversations. Sophisticated buyers ask how a marketplace expects to be discovered in three years, and a considered answer signals the forward thinking that supports the top of a range.
9. Real 2026 Deals and What They Actually Priced At
Disclosed transactions are the most reliable evidence available on marketplace app pricing, because the numbers are auditable. Four from 2026 illustrate how different models get valued.

Depop: what a mobile marketplace is worth
eBay and Etsy announced in February 2026 that eBay would acquire Depop for approximately $1.2 billion in cash. Etsy disclosed that Depop was running roughly $1 billion in annual gross merchandise sales with close to 60% year-over-year growth in the United States, supported by 7 million active buyers of whom nearly 90% were under 34, and more than 3 million active sellers. The deal completed at the end of July 2026.
The instructive part is the comparison with history. Etsy paid roughly $1.62 billion for Depop in 2021 and sold it for $1.2 billion five years later, with gross volume having grown in the interim. The same asset, more volume, a lower price. What changed was not the business but the market's willingness to capitalise growth without regard to profitability. Any marketplace app owner benchmarking against 2021 comparables should treat this as the correction it demonstrates.
Alia: the clearest read on platform-ecosystem app pricing
In March 2026 Dotdigital acquired Alia Software, an AI-driven list-growth and conversion app built for Shopify merchants, for $30 million initial consideration with total consideration up to $60 million subject to performance. Dotdigital disclosed that Alia added more than $8 million of annual recurring revenue as at 31 December 2025, across roughly 2,700 Shopify merchants.
That is a rare, verifiable read on ecosystem app pricing: approximately 3.75 times ARR at close, rising toward 7.5 times if the earnout is achieved in full. The structure is as informative as the number. Half the headline value sits behind performance conditions, which is how buyers bridge a valuation gap on a fast-growing asset whose growth they cannot yet underwrite. If you are selling a growing app, expect a version of this structure, and negotiate the earnout metrics with the care you apply to the headline figure. Our guidance on preparing for a technology exit covers how those terms are typically framed.
The very top of the market
For scale context, Bain recorded the Electronic Arts take-private at $56.6 billion as the largest buyout in history. A gaming and mobile app business now holds that record. That has no direct bearing on a $3 million app valuation, but it tells you the buyer universe for interactive and app assets extends all the way up, and that sponsors are willing to write the largest cheques ever written for this category.
10. Valuing With Thin Financials, in Emerging Markets, and in the Gig Economy
When the financial records are limited
Many marketplace and app businesses arrive at a sale with incomplete books. Cash-basis accounting, revenue mixed across personal and business accounts, no cohort history. This does not prevent a valuation. It changes where the evidence comes from, because marketplace apps generate an unusually rich external data trail that a buyer can verify independently of your bookkeeping:
- Platform revenue reports. App Store Connect, Google Play Console, the Shopify Partner dashboard and Salesforce AppExchange reporting all produce revenue and payout records the buyer can verify at source.
- Payment processor exports. Stripe, PayPal and similar processors provide transaction-level history, refund rates, chargeback rates and subscription status. This is often better evidence than the accounts.
- Analytics and attribution data. Install, retention and engagement cohorts reconstructed from analytics platforms, which lets a buyer build the retention curve even where you never reported one.
- Marketplace operational exports. Listing, match and completion data straight from the platform database, which is where liquidity and repeat rate can be demonstrated.
The realistic expectation is a discount rather than a refusal. Businesses going to market on unverified numbers transact at the lower end of their range, and some do not close once diligence exposes gaps. Three to six months of clean accrual accounting plus a reconstructed cohort history is one of the highest-return preparation exercises available, frequently worth more than a full turn. FE International's due diligence services exist partly because this reconstruction work is specialised.
Emerging market marketplace apps
Geography affects marketplace app valuation primarily through revenue per user and currency risk, not through user counts. RevenueCat's subscription data puts median realised lifetime value per payer after the first year at $32 in North America against a $23 global median and $14 in India and Southeast Asia. An app with excellent engagement in a low-monetisation market can carry the same user base as a North American peer and less than half the revenue, and the multiple follows revenue.
The growth side of that trade is genuinely attractive, and it is where 2026 momentum sits. AppsFlyer reported that Android paid installs became the majority of all Android installs for the first time, reflecting a wave of new paying consumers in emerging markets, with the short-form drama category growing paid installs 155% year over year on demand from India and Latin America. Buyers looking for growth are increasingly willing to take monetisation risk to get it. The strongest position is demonstrable per-user monetisation improvement over time, because that turns a discount story into a growth story.
Gig economy and labour marketplace apps
Labour marketplaces use the same take rate and liquidity framework as goods marketplaces, with three additions buyers weight heavily. Worker classification is now a quantified regulatory exposure rather than a background risk, for the reasons in Section 8. Supply reliability determines service quality in a way that does not apply to goods, so buyers examine worker retention as closely as customer retention. And the market is more local than it appears: World Bank research finds 545 online gig platforms across 186 countries, roughly three-quarters of them regional rather than global, which is the profile of most privately held labour marketplaces.
Fiverr's 2026 reporting illustrates the pattern buyers now favour in services marketplaces. Its marketplace revenue declined while services revenue grew 30%, annual active buyers fell, and yet annual spend per buyer rose 15.4% to $356 with adjusted EBITDA margin expanding to 21.4%. Fewer, higher-value, more committed customers and a better margin. In the current market that mix prices better than volume growth on thin economics, and it is a deliberate strategy a smaller platform can copy.
11. Preparing for a Premium Exit
The gap between an average outcome and a premium one is mostly built in the 12 to 24 months before a process starts. The work is unglamorous and the return is large.
- Fix the financial foundation. Move to accrual accounting, separate personal from business spending, document every add-back with support, and produce monthly cohort reporting. This is the precondition for everything else.
- Shift growth composition toward frequency. Frequency and repeat-rate growth is valued above user-count growth and far above price-led growth. Membership, subscription tiers and habit mechanics are the levers.
- Reduce concentration on both sides. Bring the largest participant below 5% of volume. For a marketplace this means recruiting supply breadth; for an app it means diversifying acquisition channels.
- Remove yourself from the operation. Document processes, hire or promote for sales, support and engineering, and demonstrate a quarter where the business ran without you. Owner dependency is the most reliably priced discount in the category.
- Map your platform and regulatory exposure. Know which commission schedules apply to which revenue, in which jurisdictions, and where the European platform work rules touch your engagement model. Present the analysis rather than waiting to be asked.
- Clear the technical debt that a buyer would reserve against. Update unsupported dependencies, add test coverage to critical paths, and ensure more than one person understands the system.
- Get an independent valuation early. Knowing your range 18 months out tells you which of the drivers above will move your number most, which is a very different exercise from finding out at offer stage.
Choosing who runs the process
Process quality affects price as much as asset quality, because value in a private transaction is set by competitive tension rather than by a formula. When assessing who should represent a marketplace app, the useful questions are concrete: has the firm closed deals in this specific category, can it show comparable outcomes, does it reach institutional buyers as well as individuals, does it handle diligence and legal documentation in house, and what proportion of its mandates actually complete.
FE International has completed more than 1,500 transactions since 2010 at a 94.1% completion rate, with an average transaction value of $48 million and a dedicated marketplace apps advisory team. Securities services are offered through FE Capital Markets LLC, a registered broker-dealer and member of FINRA. Sector specialisation matters here because the metrics that price a two-sided marketplace are not the metrics that price a subscription app, and a generalist tends to present the wrong ones. Published client outcomes across technology verticals are the most direct way to assess that. Businesses valued under $1 million are usually better served by a self-serve route: the FE International M&A Platform covers both buyers and sellers at that end of the market and works alongside full advisory rather than replacing it.
What This Means for Your Exit
Marketplace app valuation in 2026 rewards evidence. The three business models under the label are priced on different metrics, so the first task is classifying yours correctly. From there, the numbers buyers examine are specific and checkable: net take rate after pass-through, liquidity and match rate, cohort retention and repeat behaviour, concentration on both sides of the platform, and the growth composition behind the headline rate. The 2026 additions to that list are platform commission structure and, for anything organising work in Europe, the December deadline on platform work rules.
The capital environment is favourable. Buyout and exit values reached their second-highest levels on record in 2025 with $1.3 trillion of dry powder still available, and disclosed 2026 transactions from Depop at roughly 1.2 times gross volume to Alia at up to 7.5 times ARR show a market actively pricing marketplace and app assets across every size band. Buyers are selective, which is genuinely good news for prepared sellers, because selectivity is what creates the spread between an average outcome and a premium one.
The most useful next step is knowing your actual number rather than a range from an article. FE International provides a confidential, no-obligation valuation drawing on transaction comparables from more than 1,500 completed deals across the marketplace apps sector and every other technology vertical.
Ready to find out what your marketplace app is worth? Get a free, confidential valuation from FE International.
Founders exploring options rather than committing can review the marketplace apps market report for sector trends, or how private sales and acquisitions and investment banking mandates differ by deal size. Buyers researching the category may find our guide to acquiring an online business a useful companion.
