


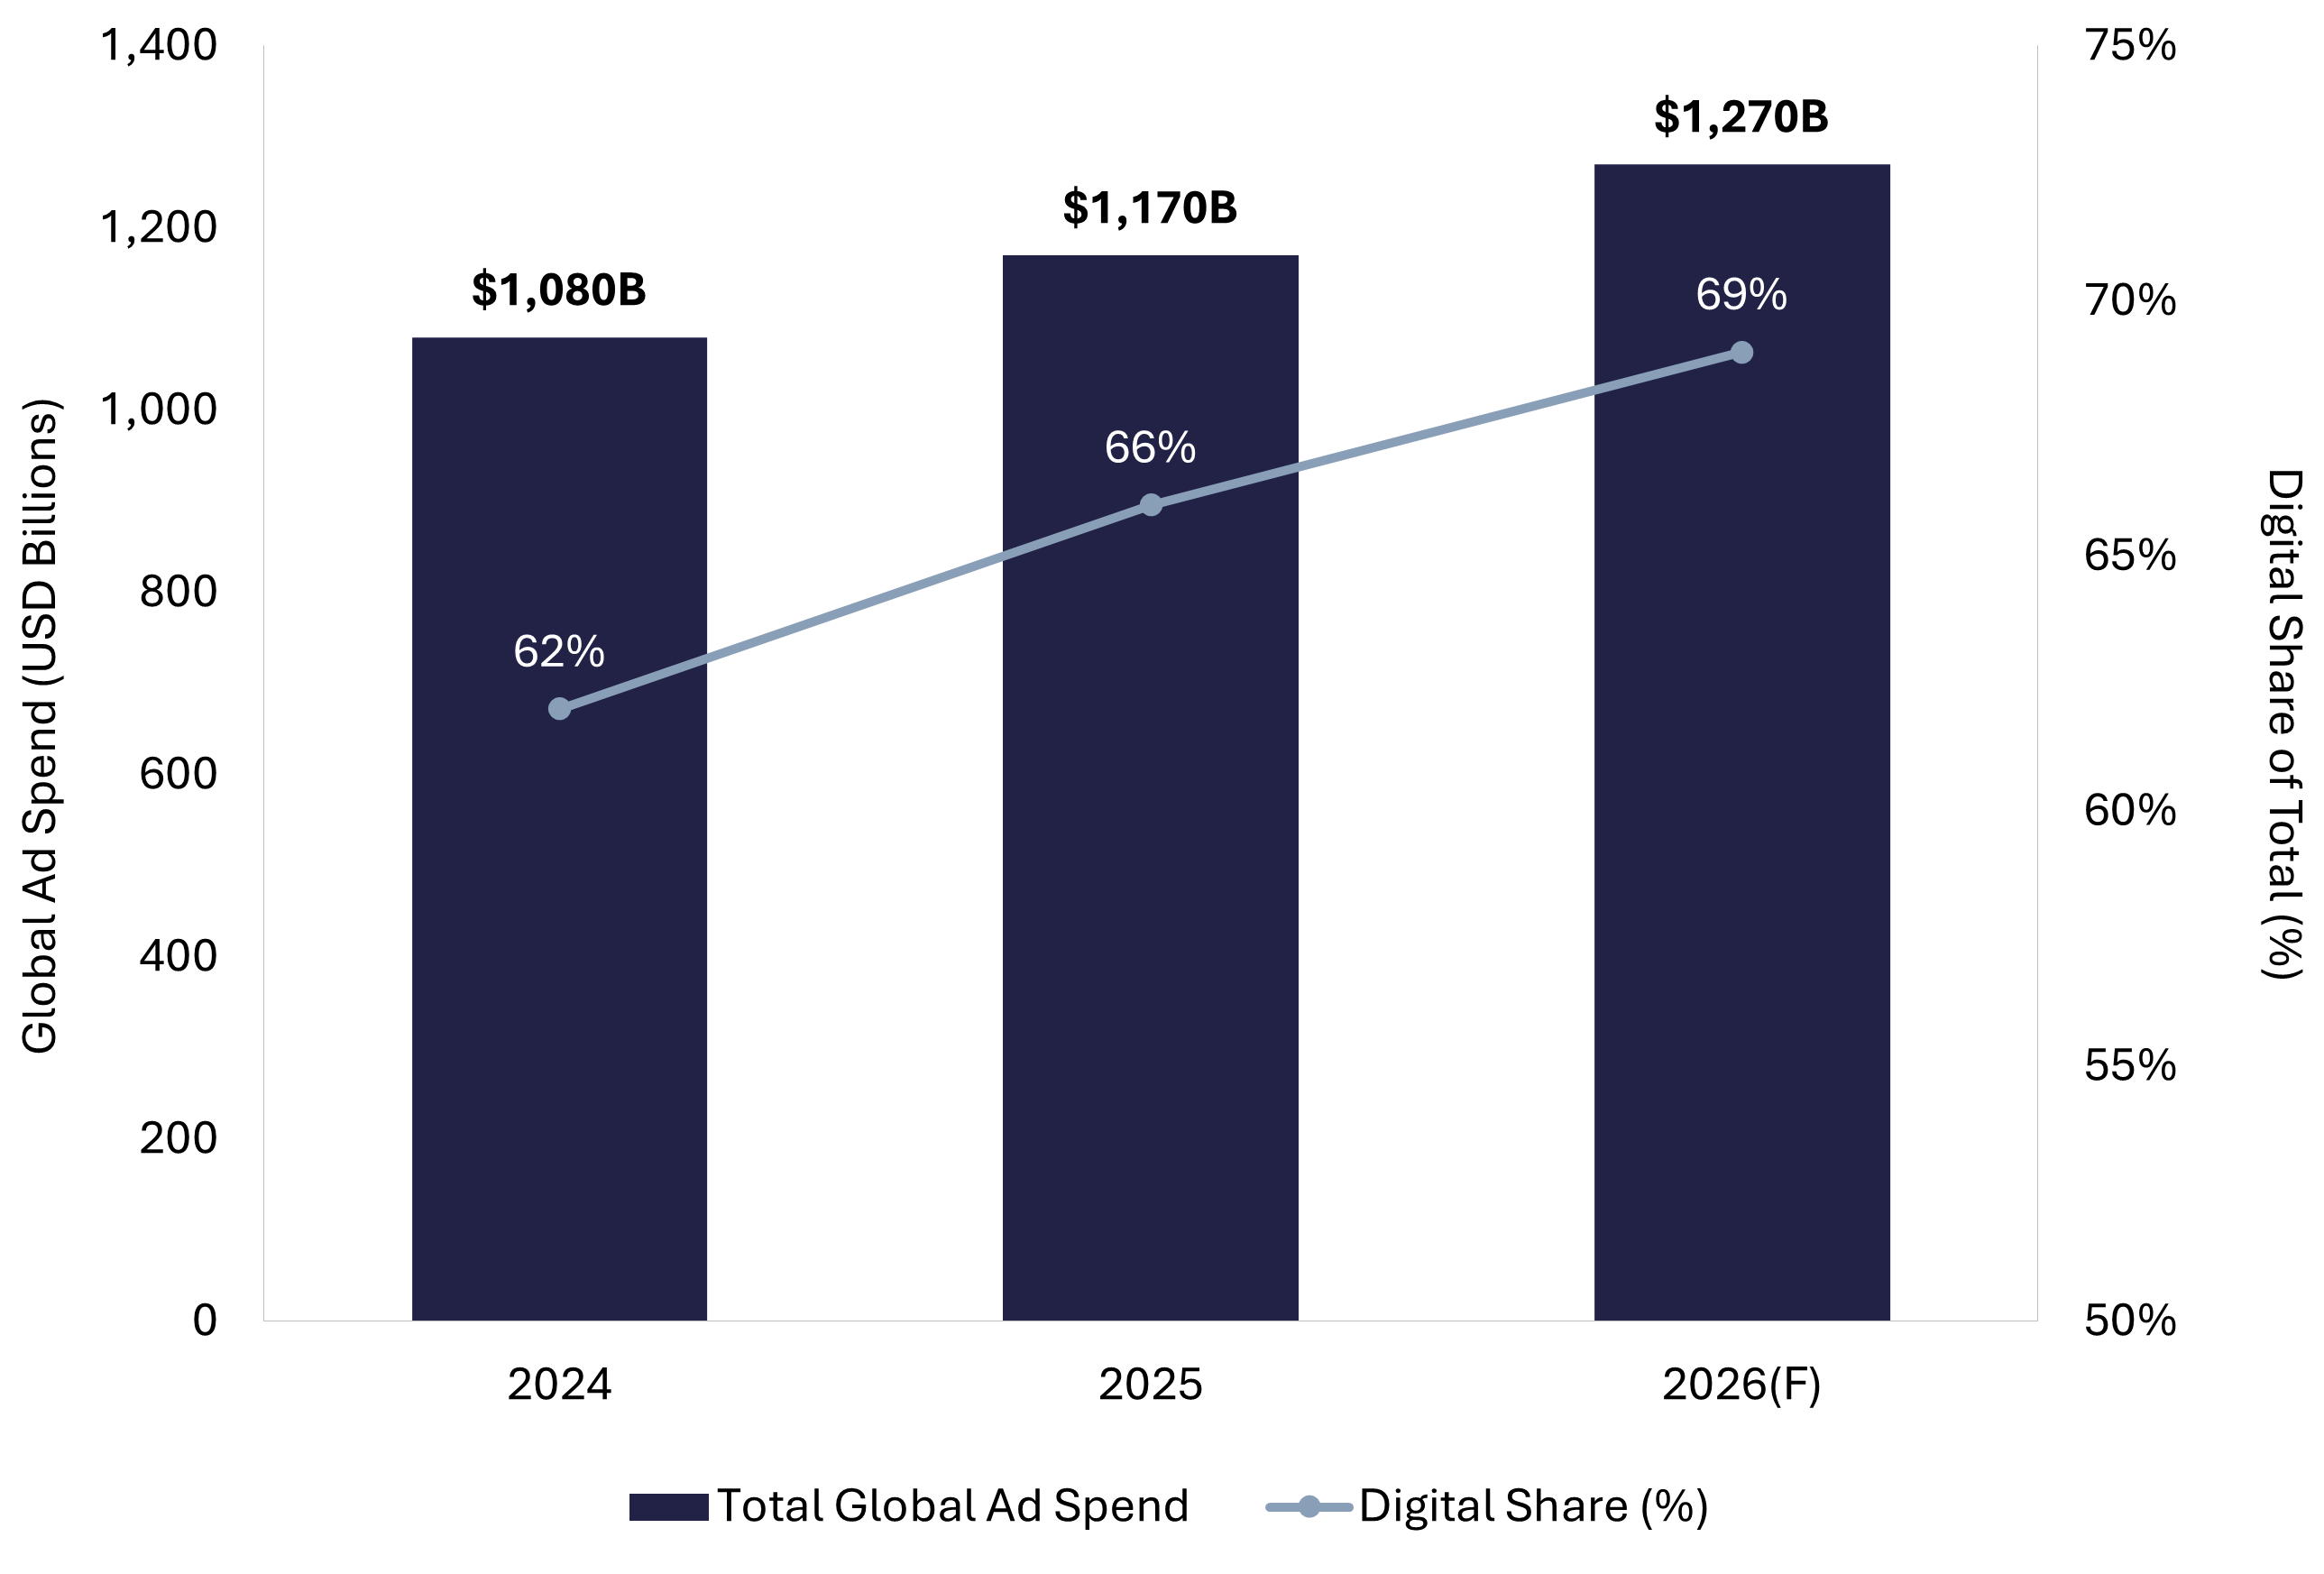
Digital marketing agency valuation in 2026 sits at a fascinating inflection point. Global advertising spend is on track to cross $1.27 trillion this year, with digital channels claiming nearly 69% of that pie. Global M&A activity reached a record $1.6 trillion in Q1 2026 alone, up 50.6% year-over-year. And the Omnicom-IPG mega-merger closed in November 2025, creating a $25 billion combined entity that reshaped the competitive map almost overnight.
For founders thinking about an exit, buyers building a platform, and operators measuring where their business stands, the question is sharper than it has been in years: what is a digital marketing agency actually worth in 2026?
The short answer is between 3x and 12x adjusted EBITDA, depending on size, recurring revenue mix, growth, client concentration, and AI integration. The longer answer, which is what this guide covers, breaks down every method buyers use, the 2026 benchmark data by agency size, the value drivers that push multiples up, the detractors that compress them, and real deal examples from the last twelve months. It is written for both sides of the table: sellers preparing for an exit and buyers building positions in the space.
Whether you run a 10-person SEO shop generating $400,000 in seller's discretionary earnings or a 120-person creative platform clearing $5 million in EBITDA, the principles are the same. Bigger numbers, sharper benchmarks, and a buyer pool that has gotten meaningfully more selective. FE International advises agencies across the full size spectrum, and the FE International M&A Platform connects buyers and sellers of smaller agencies (typically under $1 million in revenue) directly. Both routes feed into the same goal: an accurate valuation, a clean process, and a strong outcome.
The 2026 Market Context: Why Agency Valuations Are at Decade Highs
The macro picture for marketing agency M&A in 2026 is the strongest it has been since the post-pandemic surge. Global M&A deal value hit $4.9 trillion in 2025, the highest total since 2021, on roughly 50,800 transactions. Technology M&A alone jumped 77% year-over-year. The Q1 2026 PitchBook Global M&A Report shows the momentum carrying into this year, with $1.6 trillion in quarterly deal value, even after stripping out the SpaceX-xAI mega-transaction.
Three forces are driving this cycle in the agency space specifically.
The first is consolidation at the top. The closing of the Omnicom and Interpublic Group merger in late November 2025 produced a holding company with combined revenue north of $25 billion and more than 100,000 employees worldwide. That deal triggered a wait-and-see pause through the back half of 2025 as agency CEOs reassessed their competitive positioning. By Q1 2026, that pause had ended. Holding companies and mid-cap acquirers were back in the market, looking for capability-led acquisitions in performance marketing, retail media, connected TV, and identity infrastructure.
The second force is private equity. According to PwC's 2026 Global M&A trends in private equity report, PE sponsors entered 2026 with record dry powder. Mega-deals accounted for more than 73% of the increase in deal value through 2025, and PE-backed platforms have been a defining driver of professional-services M&A. Agency rollups are now a category of their own: a PE-backed platform acquires a base agency, then executes bolt-on acquisitions to add geographic reach, vertical specialization, or service capabilities. FE International's own analysis of agency and marketing M&A in 2026 shows this pattern across multiple verticals.
The third force is artificial intelligence. J.P. Morgan's 2026 agency outlook captured the shift bluntly: AI has moved from deal-delayer to deal-driver. The biggest hurdle in agency M&A through 2024 was uncertainty about how AI would affect agency margins and headcount. By early 2026, that ambiguity has cleared. Agencies that genuinely operationalize AI inside delivery (faster production cycles, productized research and content workflows, higher output per strategist) command a measurable valuation premium. Agencies that have not adapted face a discount.
For sellers, this combination of strategic consolidation, PE capital, and AI as a tailwind has produced strong buyer demand and competitive offers. For buyers, the same forces mean process discipline matters more than ever: the best targets attract multiple bidders quickly, and pricing diligence has to be backed by current comp data, not stale rules of thumb.
Five Methods Used to Value a Digital Marketing Agency
Most digital marketing agency valuations end up anchored to an earnings multiple, but the right starting method depends on agency size, revenue mix, and the buyer profile most likely to acquire the business. There are five methods that show up consistently in 2026 transactions.
EBITDA-based valuation (the standard method)
Adjusted EBITDA multiplied by a market-appropriate multiple is the dominant method for agencies above roughly $500,000 in annual earnings. EBITDA strips out interest, taxes, depreciation, and amortization to isolate operating cash generation, then gets adjusted for owner compensation above market, one-time expenses, and non-recurring items. This method dominates because it focuses directly on cash flow, which is what every buyer underwrites. For most digital marketing agencies in 2026, EBITDA multiples land between 3x and 7x, with strategic outliers reaching 8x to 12x.
SDE-based valuation (for smaller, owner-operated agencies)
Seller's Discretionary Earnings adds the owner's salary and benefits back to net profit, capturing the total economic benefit a single operator pulls from the business. SDE is the right method when the founder is heavily involved in delivery or business development and the agency runs on a single-operator economic model, typically with revenue under $2 million or EBITDA under $500,000. SDE multiples for digital marketing agencies usually fall between 2x and 4x. When converting between methods, EBITDA multiples are typically 0.7 to 0.8 times the equivalent SDE multiple, depending on how much owner-related compensation gets normalized.
Revenue multiples (used sparingly)
Revenue multiples come into play for two specific situations: high-growth agencies where current-year EBITDA is depressed by growth hiring, and agencies where earnings are too volatile to anchor reliably. Most digital agencies trade between 0.4x and 1.0x trailing revenue, with the upper end reserved for highly recurring, retainer-heavy books. Revenue multiples generally serve as a sanity check or a valuation floor rather than the primary method.
Discounted cash flow
DCF estimates value as the present value of projected future cash flows. For mature, cash-generating agencies it can triangulate against the earnings multiple, but most middle-market and lower-middle-market agency deals do not lean on it heavily. The reason is practical: forecasting agency cash flows five years out, with a defensible discount rate, is difficult at this scale. Buyers tend to use comparables and precedent transactions as the primary lens, with DCF as a secondary check.
Asset-based valuation (rare for agencies)
Asset-based methods come into play when an agency carries tangible book value, such as an insurance book of business or long-term staffing contracts. For pure digital marketing agencies, where the assets are people, processes, and client relationships, this method is largely irrelevant.
Across all five, the practical reality is straightforward: most agencies above $1 million in EBITDA are valued on an earnings multiple, anchored to comparable transactions in the same vertical and size range. The FE International agency business valuation guide covers the worked examples for each method across digital, staffing, and insurance agencies.
2026 EBITDA Multiple Benchmarks by Size and Agency Type
Size is the single biggest determinant of the multiple. Smaller agencies trade lower because of buyer-side risk: more founder dependency, less mature operations, smaller buyer pool, harder financing. As agencies scale into the lower-middle-market and middle-market, the buyer universe expands to include private equity platforms and strategic acquirers, both of which can underwrite higher multiples backed by integration synergies and cheap leverage.
Here are the 2026 EBITDA multiple bands FE International observes across digital marketing agency transactions, validated against PitchBook deal data and current public agency comparables.
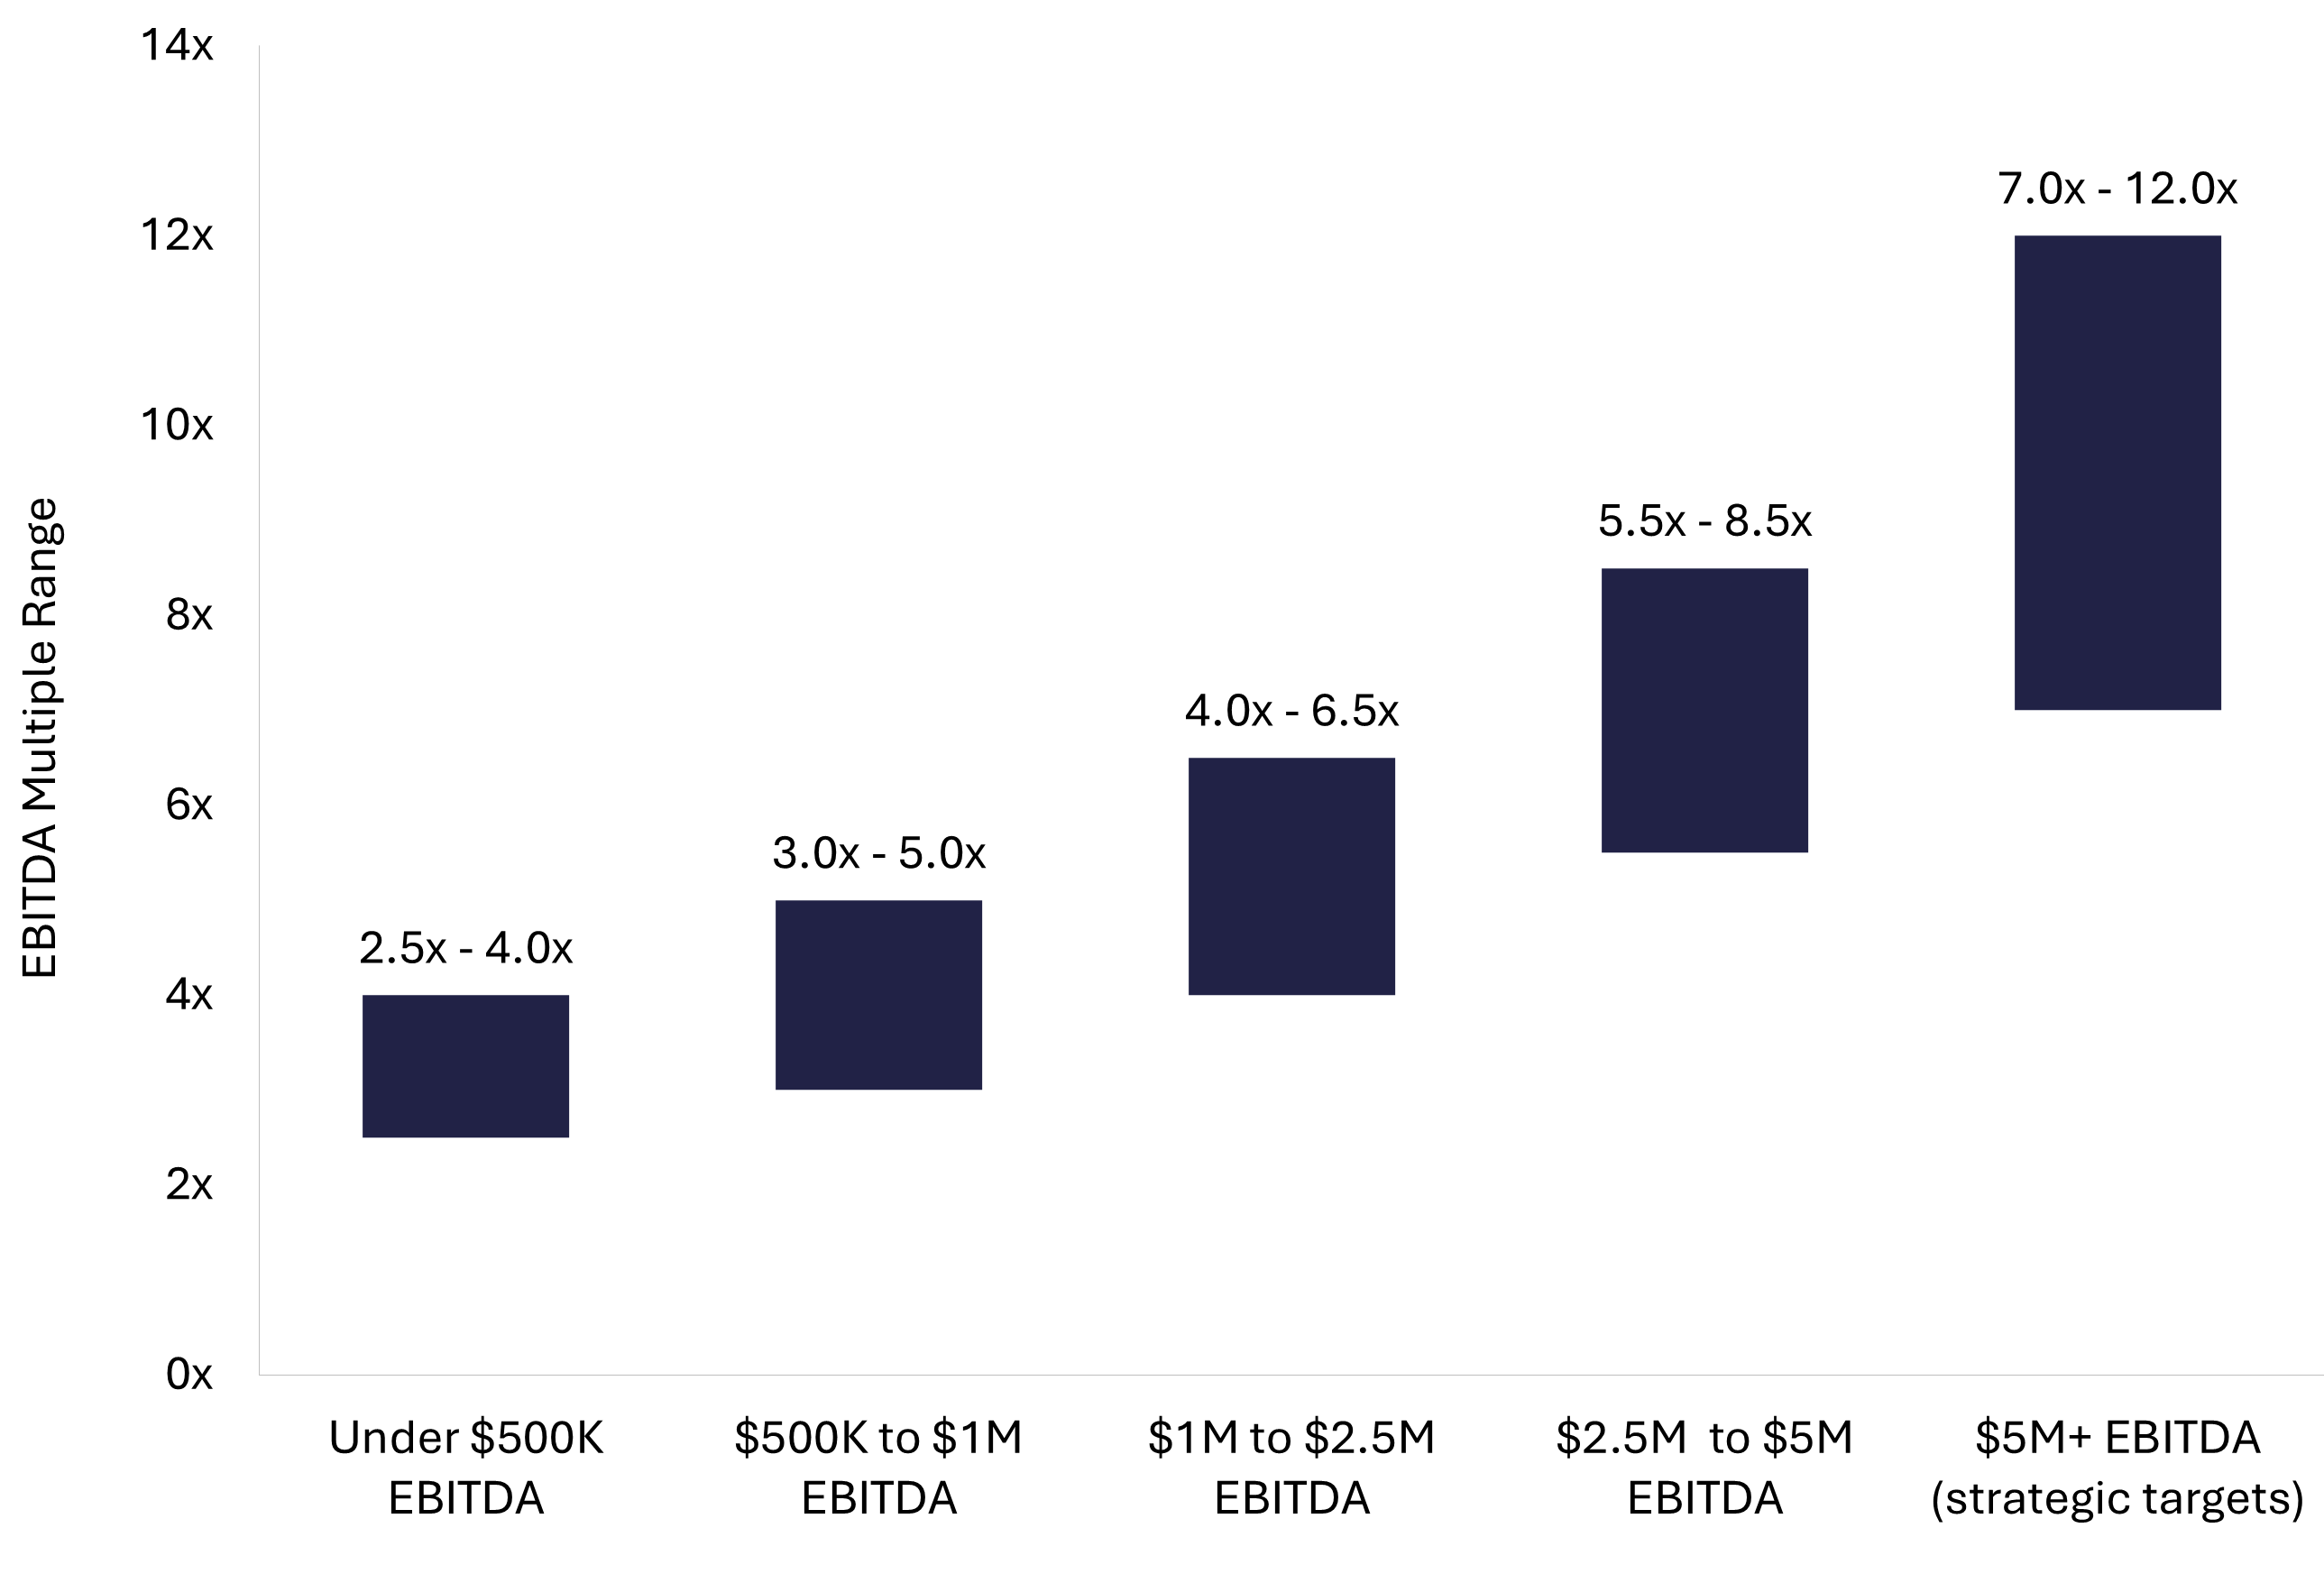
Under $500,000 EBITDA: 2.5x to 4x
Agencies at this scale are typically valued on SDE (2.5x to 3.5x SDE is more common than EBITDA at this tier). The buyer pool is dominated by individual acquirers, search funds, and small operators looking for owner-operator opportunities. Pricing reflects the higher integration and continuity risk: most of the agency's value sits in founder relationships, and demonstrating that delivery and client retention survive a transition is critical.
$500,000 to $1 million EBITDA: 3x to 5x
This is the upper end of the SDE-anchored band and the lower end of where EBITDA-based methods start to make sense. Agencies here usually have a small leadership bench, some retainer revenue, and 10 to 25 people on staff. The buyer pool widens to include lower-middle-market PE platforms doing add-on acquisitions, family offices, and strategic acquirers looking to add specific capabilities or geographies. For agencies in this band, the route to market matters: an experienced advisor or a curated platform like the FE International M&A Platform can dramatically expand buyer access compared with a generalist listing.
$1 million to $2.5 million EBITDA: 4x to 6.5x
This is where the multiple expansion really begins. Agencies at this size attract PE platforms running roll-up strategies, who are willing to pay up for clean financials, a defensible vertical specialization, and a path to combining the business with other portfolio agencies. Recurring retainer revenue above 60% of mix, sustained EBITDA margin above 20%, and client concentration below 15% are the qualifying criteria for the high end of this band.
$2.5 million to $5 million EBITDA: 5.5x to 8.5x
Agencies in this band are firmly in the lower-middle-market and routinely attract competitive auction processes. Specialization carries a real premium here: a 40-person performance marketing agency dedicated to B2B SaaS clients with $3 million in EBITDA can command 7x or higher. The same EBITDA in a generalist creative shop tends to come in 1.5x to 2x lower.
$5 million-plus EBITDA: 7x to 12x
Above $5 million in EBITDA, agencies become strategic targets for both holding companies and large PE platforms. Industry research has documented that agencies with average adjusted EBITDA around $2.4 million achieve multiples around 6.46x in recent transactions, with strategic deals reaching as high as 12x for businesses with unique capabilities or proprietary technology. The Omnicom-IPG merger reset reference points at the very top of this range, and PE platforms with several portfolio agencies under management are willing to pay strategic premiums for capability-defining additions.
Agency type and specialization effects
Agency category modifies the bands above. Performance marketing shops with strong unit economics and high net revenue retention price at the higher end. Search and PPC agencies, where client expectations around measurable ROI create stickier engagements, also tend to clear the upper bands when retainer mix is strong. B2B-focused agencies in growth verticals (B2B SaaS, fintech, healthcare technology, legal services) carry a premium over generalist consumer shops. Creative-led studios with project-heavy revenue compress toward the lower end of each band unless they have built durable, productized service lines.
Geography matters less than it used to. Cross-border agency M&A is up materially, with US buyers acquiring UK and European agencies, and vice versa. International agencies do carry a modest discount where currency, regulatory, or operational complexity weigh on the buyer underwriting model, but the gap has narrowed.
Adjusted EBITDA: What Buyers Actually Use
Headline EBITDA from a tax return rarely reflects what a buyer will pay a multiple on. Adjusted EBITDA, sometimes called normalized EBITDA, makes a series of defensible adjustments to arrive at the cash generation a new owner would actually inherit. Getting this calculation right is where many agency owners leave six and seven figures on the table.
The standard adjustments fall into four buckets.
Owner compensation normalization
If the founder draws a $400,000 salary plus discretionary bonuses while a market-rate replacement would cost $180,000, the difference ($220,000) gets added back to EBITDA. Conversely, if the founder pays themselves below market because most cash flow drops to the bottom line, an add-down may apply. Buyers test these adjustments hard. The defensible documentation is current third-party comp benchmarks for the role a new owner or hired manager would actually perform.
Non-recurring expenses
One-time costs that will not recur under new ownership get added back. Common examples include legal fees from a one-off matter, the cost of an aborted office expansion, an unusual writedown, founder personal expenses run through the business, severance from a single restructuring event, or pandemic-era costs that have no 2026 equivalent. Every add-back needs evidence: invoices, board minutes, or accounting workpapers. A buyer's Quality of Earnings advisor will trace each adjustment back to source documentation.
Non-operational items
Income or expenses unrelated to the core agency operation, such as gain or loss on the sale of a vehicle, rental income from sub-leased office space, or a related-party transaction, get backed out. The goal is to isolate the operating cash generation of the actual agency business.
Run-rate adjustments for recently signed work
If a major new retainer was signed in month 10 of the trailing twelve months, a defensible run-rate adjustment annualizes the post-signing months to reflect the contracted revenue base, not the historical accident of mid-year timing. Buyers will accept these adjustments when contracts are signed, billable, and not subject to obvious renewal risk.
A worked example
Consider a mid-sized digital marketing agency reporting $3.5 million in revenue and $620,000 in pre-adjustment EBITDA for the trailing twelve months. The owner pulls a $300,000 salary, but a hired managing director would cost $175,000, producing a $125,000 add-back. The agency paid $40,000 in one-time legal fees for a settled vendor dispute and ran $20,000 in family-related travel through the business. A new client retainer signed in month 9 brings the annualized recurring revenue $90,000 higher than the trailing twelve months reflect. Adjusted EBITDA lands at $895,000. At a 5x multiple, that is a $4.475 million enterprise value, compared with the $3.1 million headline number a less rigorous valuation would produce. The FE International how-to-value-an-agency-business guide walks through the same calculation across multiple agency types.
Why Quality of Earnings matters
Above roughly $1 million in EBITDA, buyers commission a third-party Quality of Earnings report (often called a QoE) as part of diligence. The QoE either confirms the adjusted EBITDA the seller is using or strips out adjustments the analyst cannot validate. A clean QoE protects valuation. A QoE that disqualifies $200,000 of add-backs in a 6x multiple deal removes $1.2 million from enterprise value. Founders who anticipate this and prepare with a sell-side QoE or strong audit-ready records typically protect 0.5x to 1x of multiple on a deal of this size.
Value Drivers That Push Your Multiple Higher
Two agencies with identical adjusted EBITDA can sell for very different multiples. The variance comes from the qualitative drivers buyers underwrite: revenue quality, growth durability, retention, margins, and operational maturity. Below are the eight value drivers that move the multiple most in 2026 digital marketing agency deals.

Recurring retainer revenue above 60% of mix
Retainer-based revenue is the single most valuable characteristic an agency can demonstrate. Retainers compound: long-term client relationships produce predictable cash flows, lower customer acquisition costs over time, and the kind of revenue visibility a PE buyer or strategic acquirer needs to underwrite a multi-year hold. Industry research on agency retention is clear: retainer agencies achieve roughly 2.3x better retention than project-based shops, with average client lifespans of nearly five years versus two years. An agency with 70%-plus retainer mix typically commands a multiple 1.0x to 2.0x higher than an otherwise-identical project-based shop.
EBITDA margin above 20% (sustained)
Buyers underwrite agencies on cash generation efficiency. A 20% EBITDA margin signals that the agency has its compensation expense, overhead, and service mix under control. Below 15%, buyers see margin risk; the agency might be one client loss or one wage round away from a breakeven year. Above 25%, buyers see operating leverage; the agency can absorb integration costs and still produce returns on invested capital. The TobinLeff buyer study of more than 60 agency acquirers found EBITDA margin to be the number-one value driver, with most buyers seeking agencies above 20% margin.
Client concentration below 10% from any single client
If one client makes up 30% of revenue and walks away post-close, the buyer's underwriting model collapses. Buyers typically require that no single client exceed 10% of revenue, with the top three clients combined staying below 25%. Agencies that meet this test command meaningful pricing premiums. Agencies with concentrations of 30%, 40%, or higher face 1x to 2x discounts off the band, plus heavier earnout-based deal structures.
Sustainable 15%-plus YoY revenue growth
Growth signals two things to buyers: there is product-market fit in the service offering, and the agency has a working go-to-market motion that will continue post-acquisition. Buyers underwrite the future cash flow stream, not the historical one. An agency growing 20% year-over-year with 22% EBITDA margins is, for valuation purposes, a different business than the same agency at 0% growth, even if the trailing EBITDA is identical. The premium for sustained, demonstrable growth in 2026 deals lands in the 0.75x to 1.5x range.
Real AI integration
This is covered in depth in the next section, but the headline is straightforward: agencies that have genuinely integrated AI into delivery workflows command a 1x to 2x EBITDA multiple premium in 2026 deals. The qualifier is important. AI tools bolted onto the surface of a service offering do not move the multiple. AI woven into pricing, production, reporting, and client analytics does.
Strong leadership bench (low owner dependency)
Buyers underwrite the business that exists after the founder leaves. If client relationships, business development, and delivery quality all hinge on one person, the buyer is acquiring a single point of failure. Agencies with a strong managing director, a head of growth, and a head of delivery (or equivalent functional leadership) reduce this risk substantially. The discount for high owner dependency is one of the most reliable patterns in agency M&A. The premium for a real leadership bench typically runs 0.5x to 1.5x.
Client retention above 90% annually
Retention is closely related to recurring revenue but is its own driver. Buyers will go back three to four years of client data, calculating annual retention by logo and by revenue. Agencies above 90% annual logo retention and above 95% revenue retention are in the top quartile and price accordingly. Below 80%, buyers begin to model client replacement costs into their underwriting, and the multiple compresses.
Service specialization or vertical focus
Specialization is a defensible moat. A 50-person agency that has built a category leadership position in B2B SaaS, healthcare technology, legal services, or home services becomes a strategic target the moment a PE platform decides to enter that vertical. Generalist agencies competing on quality of service alone face more buyers but fewer strategic premiums. Specialization premium in 2026 deals typically runs 0.5x to 1.5x, with the high end going to agencies that own a clear niche.
The AI Premium and How Buyers Underwrite It in 2026
AI is the most important new variable in digital marketing agency valuation since the shift from project to retainer revenue. PwC's 2026 AI Business Predictions describe the divide bluntly: a small group of companies are realizing extraordinary value from AI (top-line growth and significant valuation premiums), while many others are seeing modest, hard-to-measure productivity gains. In agency M&A, that divide directly translates to multiple expansion or compression.
Three data points frame the 2026 picture.
First, AI adoption in marketing is now near-universal. Industry data shows 88% of marketers using AI tools daily, with generative AI now embedded in roughly 15% of all marketing activities (up 116% year-over-year). Junior copywriting headcount is contracting (23% of agencies reduced junior copywriting in 2025) while senior strategist demand is climbing. Second, McKinsey's State of AI 2025 found that only about 6% of companies are achieving real EBIT impact from AI, and that the determinant is workflow redesign, not surface features. Third, J.P. Morgan's 2026 agency outlook describes AI as having shifted from deal-delayer to deal-driver: the agencies that have demonstrated genuine AI integration are now commanding premium multiples, while those that have not are seeing offers compress.
From a buyer's perspective, here is what counts as real AI integration in 2026 agency deals.
- Productivity per FTE measurably improved. Buyers want evidence: hours-saved-per-deliverable benchmarks, faster turnaround times on standard work products, higher output per strategist documented over consecutive quarters.
- AI-native service lines that command premium pricing. Predictive personalization, AI-driven media optimization, and analytics-as-a-service offerings that link directly to client ROI uplift, rather than marketed as add-ons.
- Proprietary data assets. A library of client campaign performance data, audience-level engagement data, or workflow performance data that creates a defensible competitive position is the asset buyers underwrite. Features built on top of generic models can be replicated. Proprietary datasets cannot.
- Workflow integration, not bolted-on tools. AI that lives in a sidebar of an existing process is treated as commodity. AI that is woven into how the agency prices work, produces deliverables, and reports results is treated as durable competitive advantage.
The valuation arithmetic is significant. An agency at the high end of its size band might see a 1x to 2x EBITDA multiple uplift from demonstrable AI integration. For a $2 million EBITDA agency, that is $2 million to $4 million of enterprise value. The reverse is also true: agencies that compete in commodified service categories (basic content production, generic paid social, undifferentiated SEO) are facing pricing pressure as clients credit AI for productivity gains. FE International's AI M&A trends 2026 analysis covers the broader sector dynamics, and the AI business valuation model guide walks through valuation frameworks for AI-native businesses where AI is the core value proposition.
The practical takeaway for sellers is that demonstrating AI integration during diligence requires preparation. Documented productivity benchmarks, named AI-driven service lines with separate margin reporting, and client-level outcome data are the artifacts buyers want to see. For buyers, the underwriting question has shifted: it is not whether the target uses AI, it is whether the use of AI is reshaping the unit economics of the business in ways that show up in margin and retention numbers. The Stanford AI Index provides additional sector-level context on corporate AI investment trends.
Value Detractors That Compress Multiples
The downside drivers tend to be inverses of the upside drivers, but they carry asymmetric weight in buyer underwriting. A single significant detractor can pull a multiple down by 1x to 2x even when other indicators are strong. The four most common in 2026 agency transactions are below.
High client concentration
Client concentration above 20% from any single client is the most reliable multiple compressor in agency M&A. Buyers model the financial impact of losing the top client immediately after close, and the worse that scenario looks, the more aggressive the price reduction or the heavier the earnout. Agencies with a single client at 30% to 40% of revenue typically face 1.5x to 2x discounts off the band, plus deal structures that put 25% to 40% of consideration into multi-year earnouts tied to client retention. The fix is straightforward but takes time: 12 to 24 months of intentional new-client acquisition, ideally with smaller individual contract sizes, redistributes the revenue base and reopens the multiple range.
Owner dependency
If the founder is the lead salesperson, the lead client relationship owner, and the de facto head of delivery, the agency is effectively a single-operator business. Buyers model the cost of replacing the founder's three roles plus the integration risk of doing so post-close. Agencies with high owner dependency tend to face an SDE-based valuation (lower multiples), heavier earnouts, and longer founder transition commitments. The 12 to 24 months before a sale is exactly the right window to build a leadership bench and document the systems that currently live in the founder's head.
Project-based revenue mix
Project revenue is not bad revenue; it can be highly profitable. But project work is harder for buyers to underwrite because each engagement has to be re-won. Agencies with project revenue above 60% of mix routinely come in at the lower end of their size band's multiple range. The fix is converting recurring engagements: monthly retainers for ongoing work, productized service offerings with multi-month commitments, performance-based retainers tied to client outcomes. Even a partial shift from 70% project to 50% project moves the multiple meaningfully.
Volatile or declining EBITDA
Buyers underwrite the trend, not just the trailing year. An agency where EBITDA has declined 10% per year for three years, even if the absolute number is healthy, gets priced as a declining business. Conversely, an agency that has grown EBITDA at 15% per year for three consecutive years gets priced on growth-adjusted multiples. If recent results are noisier than the underlying business reality, addressing the volatility (or framing the explanation cleanly) is essential before going to market.
A practical comparison
Consider two agencies, both with $1.5 million in adjusted EBITDA. Agency A receives 60% of revenue from two large clients, has seen EBITDA decline 10% over three years, and depends heavily on the founder for client relationships. Management beyond the founder averages just two years of tenure. Agency B has no client above 15% of revenue, has grown EBITDA at 14% per year for three years, and has a managing director and head of growth with five-plus years each at the business. Both have identical EBITDA. Agency A might price at 3.5x to 4x ($5.25M to $6M). Agency B might price at 6x to 7x ($9M to $10.5M). Same earnings, $4 million to $5 million difference in enterprise value, driven entirely by the qualitative factors buyers underwrite.
Real 2026 Deal Examples and What They Reveal
Headline benchmarks are useful, but specific transactions tell a sharper story about where the market actually clears. Below are four deals from the last twelve months that illustrate different points along the size and buyer-type spectrum, plus what each tells us about 2026 valuation behavior.
Omnicom and Interpublic Group (closed November 2025)
The Omnicom-IPG merger closed on November 26, 2025, after FTC consent order approval and shareholder votes in March 2025. The structure was a stock-for-stock transaction, with each share of IPG common stock converting into 0.344 shares of Omnicom common stock. Post-close, Omnicom shareholders own 60.6% of the combined company; IPG shareholders own 39.4%. The combined entity has annual revenue of roughly $25 billion and more than 100,000 employees across the global agency footprint.
What this deal reveals: strategic mega-deals at the top of the industry trigger ripple effects throughout the M&A market. Mid-cap holding companies and independent agencies became acquisition candidates almost immediately as integration questions, client transitions, and competitive repositioning produced opportunity. For lower-middle-market sellers, the practical takeaway is that 2026 is a buyer-rich market, especially for agencies with niches that fit into the gaps holding companies are now trying to fill.
Shamrock Capital acquires Penta Group (August 2025)
Shamrock Capital, a Los Angeles-based PE firm specializing in media and communications, acquired Penta Group from Falfurrias Management Partners in August 2025. Penta is a stakeholder communications and reputation intelligence firm headquartered in Washington D.C. with global offices and reported revenue above $100 million in the year of the transaction. Roughly half of Penta's revenue is attributed to its proprietary AI, data, and predictive analytics work.
The deal was financed with a $190 million private credit package led by Churchill Asset Management, including a $140 million first-lien term loan, a $10 million revolving credit facility, and a $40 million delayed draw term loan. Pricing was set at 450 basis points over the base rate, with leverage-based ratchets tightening to 425bps below 4x EBITDA and widening to 475bps above 5x.
What this deal reveals: PE buyers in the agency and communications space are paying premium valuations for businesses where AI and proprietary data are core to the offering. The detailed financing structure (with leverage ratchets explicitly tied to EBITDA performance) also illustrates how lenders are underwriting agency businesses in 2026: as cash-generative service platforms with measurable retention and margin metrics. The deal-from-PE-to-PE structure (a so-called secondary buyout) is increasingly common, with Falfurrias exiting after taking the original majority stake in 2021.
Mubadala Capital and TWG Global acquire Clear Channel Outdoor ($6.2 billion)
Mubadala Capital and TWG Global completed the acquisition of Clear Channel Outdoor Holdings for $6.2 billion, taking the outdoor advertising platform private. Outdoor and out-of-home media are now classified inside the broader agency and marketing services M&A universe because the buyer mix (sovereign wealth, strategic platforms, large PE) overlaps directly with what is acquiring traditional agency assets.
What this deal reveals: capital is flowing into media and marketing infrastructure at every level of the stack, not just into pure-play digital agencies. For founders of agencies that touch out-of-home, connected TV, retail media, or other infrastructure-adjacent service lines, the buyer universe is broader than it was even 18 months ago.
Lower-middle-market and platform-investment deals
At the lower-middle-market level, the pattern has been a mix of strategic capability-building acquisitions and PE platform investments. Mountaingate Capital made a platform investment in Walker Sands, a B2B growth services agency, to fuel its expansion and acquisition activity. Ruder Finn acquired The Equity Group, a New York investor relations agency, to expand its investor communications capabilities. Leverage Marketing Group acquired The Simon Group, a Pennsylvania B2B marketing firm, in a transaction that closed in early March 2026. Supreme Group, a healthcare and life sciences marketing platform, acquired Broth, a science-first creative agency, to deepen its evidence-based offering. The Shamrock Capital portfolio includes other communications and marketing platform investments as well.
What these deals reveal: the lower-middle-market buyer pool is unusually deep, with multiple competing PE platforms, family offices, and strategic acquirers running active acquisition programs. For agency owners considering an exit in 2026, this depth translates directly to better processes, faster timelines, and stronger pricing tension between bidders.
Deal Structures: Cash, Earnouts, Equity Rollover, and Seller Notes
Headline price is one number. Deal structure is what determines how much of that headline actually lands in the seller's bank account at close, and how much is contingent on post-close performance. Understanding the structure is just as important as understanding the multiple.
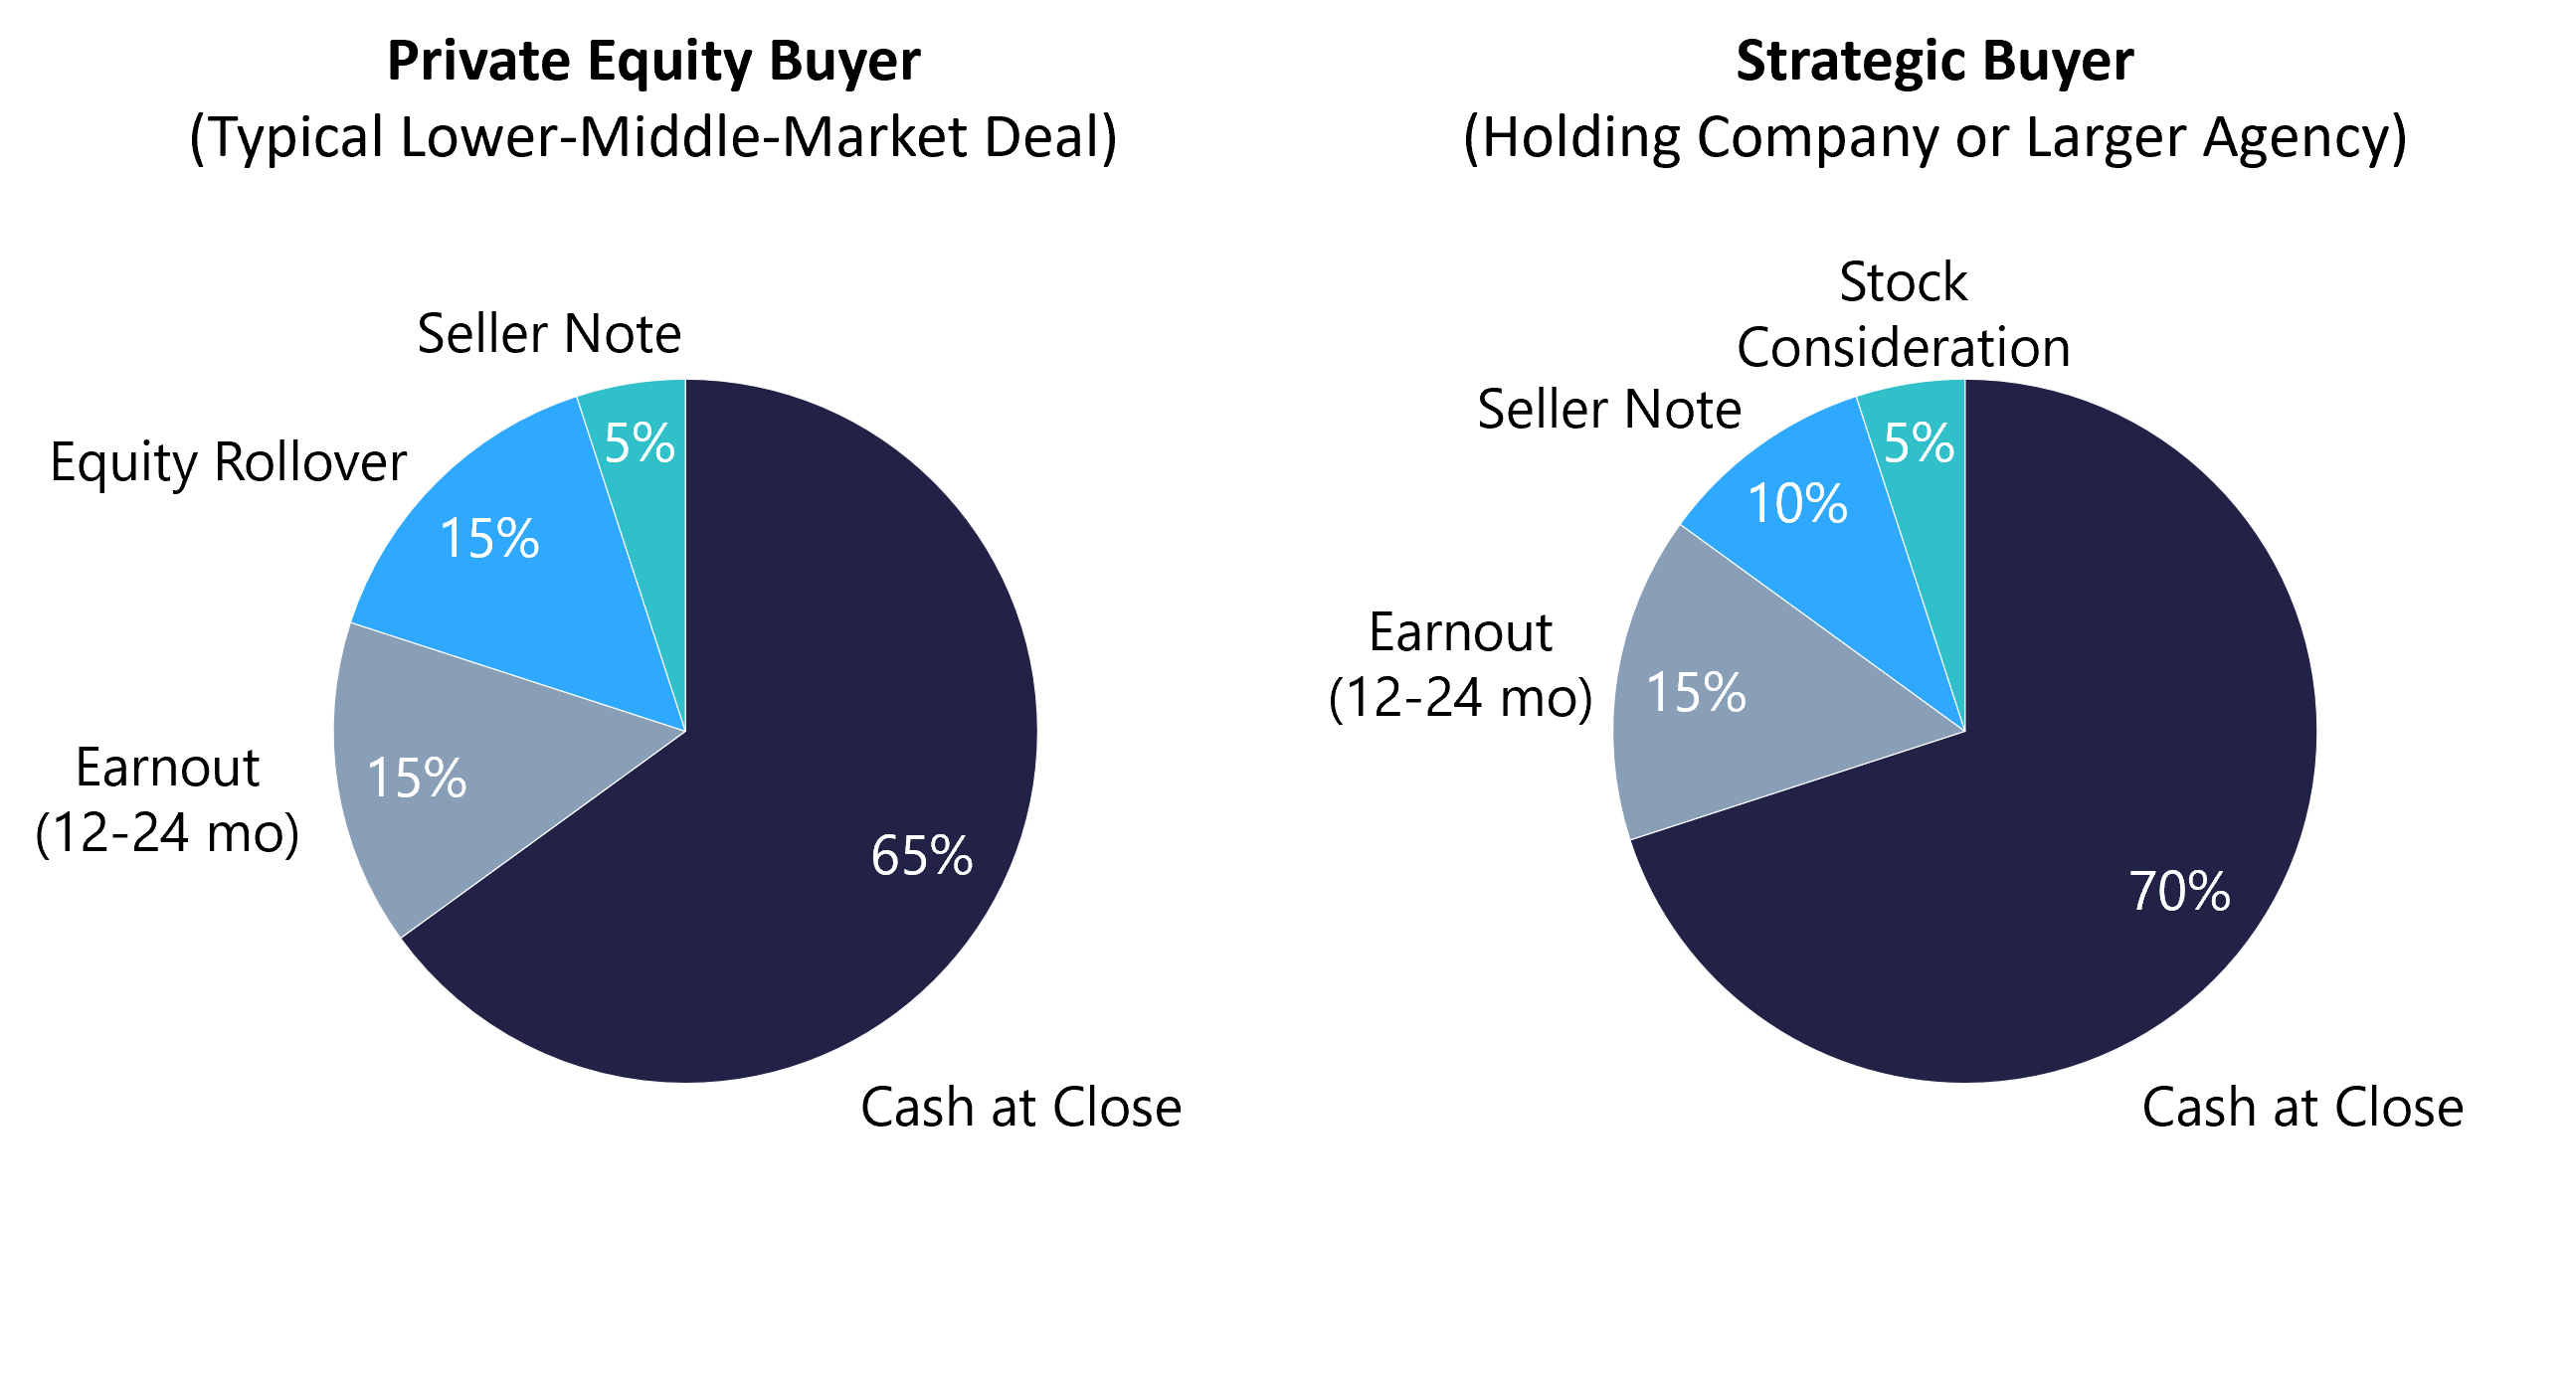
Cash at close
In a typical 2026 lower-middle-market digital marketing agency deal, 60% to 70% of consideration is paid in cash at close. Strategic buyers tend to offer slightly more cash than PE buyers, who often allocate some of the consideration to equity rollover instead. The mix shifts when there is structural risk in the business (high client concentration, owner dependency, recent EBITDA volatility): in those cases, cash at close can drop to 50% or below, with the balance pushed into earnouts. FE International's agency M&A 2026 analysis describes the typical 60-70% cash structure as the default for clean lower-middle-market deals.
Earnouts tied to retention or revenue
Earnouts make up 10% to 20% of consideration in typical agency deals and run for 12 to 24 months post-close. The most common earnout structure ties payment to client retention thresholds (often a 90% retention requirement for top-10 clients) or revenue performance against a budget set at signing. Earnouts protect buyers against post-close client attrition and align seller incentives with a smooth transition. They protect sellers, in turn, by allowing a higher headline price than buyers would otherwise underwrite. Negotiating clear, measurable earnout metrics and avoiding excessive buyer control over operational decisions during the earnout period is one of the most important deal points in agency M&A.
Equity rollover (PE deals)
In PE-led acquisitions, sellers commonly roll 10% to 25% of consideration into equity of the acquiring platform. This rollover gives the founder a minority stake in a larger combined entity and the opportunity to participate in a second exit, typically three to five years down the road. The math here can be compelling. According to PwC's private equity 2026 outlook, sponsors have record dry powder available, and platform-plus-bolt-on strategies often produce a meaningful uplift in multiple between the entry deal and the eventual platform exit. A 1x rollover on the first deal can convert to a 1.5x to 2x return at the second exit if the platform performs.
Seller notes
Seller notes (a portion of the purchase price paid via promissory note over 12 to 60 months at a contractually defined interest rate) are most common in smaller deals where buyer financing is the constraining factor. For agencies under $1 million in EBITDA being bought by individual acquirers or search funds, seller notes can make up 10% to 25% of consideration. They effectively bridge the financing gap and let deals close at multiples that would otherwise require more cash. The trade-off is credit risk on the buyer over the note term.
Working capital pegs and the EV to equity bridge
The headline enterprise value is not the same as the cash that lands in the seller's account at close. The working capital peg requires a target level of working capital be delivered at close; any shortfall reduces purchase price dollar-for-dollar. Existing debt is typically paid off at close from the purchase price. Net cash above an agreed minimum stays with the seller. The result is the equity bridge that takes enterprise value to actual proceeds. Founders who model this carefully ahead of time avoid late-stage surprises during the closing mechanics.
Buyer Types and the Path That Fits Your Agency
Three buyer profiles dominate agency M&A in 2026. Each underwrites differently, structures differently, and pays for different attributes. Understanding which buyer type fits a specific agency is one of the most important early decisions in an exit process.
Strategic buyers (holding companies, platform agencies, larger independents)
Strategic buyers acquire to fill specific gaps in their capability set, geographic footprint, or client portfolio. They are willing to pay above-market multiples when an acquisition produces integration synergies: cross-selling into their existing client base, adding a vertical specialization they currently lack, or acquiring talent that is hard to recruit. Strategic deals tend to have higher cash at close (often 70%-plus), shorter earnouts (12 months is more common than 24), and sometimes a stock component. Founder roles post-close vary widely. Some strategics want a multi-year transition with the founder running the unit; others want a clean handoff to existing management.
Private equity (platform investments and add-on acquisitions)
PE buyers fall into two sub-categories. Platform investments are where the PE firm acquires an agency to anchor a new portfolio company, typically requiring at least $1 million to $3 million in adjusted EBITDA, sometimes $500,000-plus if growth metrics are exceptional. The founder usually rolls 15% to 25% of equity and stays in a leadership role for three to five years. Add-on acquisitions are where an existing PE-backed platform buys a smaller agency to integrate. These deals tend to be faster and more standardized: four to six months from first call to close. According to the analysis in FE International's agency marketing M&A guide, PE platforms are now the most active buyer type in the lower-middle-market segment.
Individual buyers, search funds, and smaller operators
Individual acquirers, search funds, and small operating groups are the primary buyer pool for agencies under roughly $1 million in revenue. These buyers tend to want to step into an operator role and often require seller notes or earnouts to bridge financing. Deal multiples are typically lower (SDE-based, 2.5x to 4x), but the buyer pool is large, and a well-prepared listing on a curated platform can attract competing offers. Smaller agencies that want exposure to this buyer pool are well-served by listing through a dedicated M&A platform that pre-vets buyers and centralizes diligence.
Choosing the right buyer profile
There is no universally best buyer type. The right choice depends on three things: the agency's size and growth profile, what the founder wants post-close, and the specific value drivers the agency has built. A growth-stage agency with strong AI capabilities and a defensible vertical specialization is a strategic-acquisition story. A profitable lower-middle-market agency with clean financials and a leadership bench is a PE platform story. A small, founder-led agency with solid retainer revenue is a marketplace or individual-buyer story. Matching the agency profile to the buyer profile is one of the highest-impact early decisions in the process.
The 12 to 24 Month Pre-Exit Playbook
The work that produces a premium exit happens in the 12 to 24 months before the first call with a buyer, not during the deal process itself. Founders who treat the lead-up to a sale as an active strategic project routinely add 1x to 2x of multiple, plus several hundred basis points of cash-at-close, compared with founders who go to market without preparation. Below is the playbook that consistently produces those results. The FE International guide to selling an online business walks through the formal process steps. What follows is the operational preparation that should happen first.
Months 1-3: financial cleanup
Move to monthly accrual-basis financials reviewed by a quality firm. Separate personal and one-time expenses from the operating P&L. Build a 36-month historical view of revenue, gross margin, EBITDA, and adjusted EBITDA. Document every potential add-back with supporting evidence. If revenue exceeds $5 million or EBITDA exceeds $1 million, commission a sell-side Quality of Earnings report; the $30,000 to $75,000 investment routinely protects $500,000 to $2 million of valuation.
Months 3-9: improve the value drivers
Convert as much project work to retainer as the client base will support; even moving from 70% project to 50% project shifts multiples meaningfully. Diversify the client base intentionally: if one client is at 35% of revenue, sign three new accounts in adjacent verticals over the next six months. Build out the leadership bench: hire or promote a managing director, head of growth, and head of delivery so the agency runs without founder-driven daily operations. Document standard operating procedures for client onboarding, account management, and delivery.
Months 9-18: AI integration and capability investment
Identify the two or three workflows where AI integration produces the largest measurable productivity or quality gain. Document baseline and post-implementation benchmarks (hours per deliverable, turnaround times, quality scores). Build named service lines around AI-driven capabilities (predictive analytics offerings, AI-assisted creative production, automated reporting) that command premium pricing and create separately-trackable margin. By the time a buyer asks about AI integration during diligence, the agency should have documented productivity benchmarks, named service offerings with their own P&Ls, and client-level outcome data.
Months 12-24: track the metrics buyers want
Buyers will examine net revenue retention, client retention by logo and by revenue, gross margin by service line, EBITDA margin trend over 36 months, top-10-client concentration, and average revenue per FTE. Track all of these monthly with the same definitions buyers use. When diligence questions come, having clean monthly trend data ready to share signals operational maturity and accelerates timelines.
The last 3 months: choose the right advisor or route to market
By the time the agency is 90 days from going to market, the choice of route should be made. For agencies under $1 million in revenue, a curated platform that connects qualified buyers directly is typically the most efficient option. For agencies $1 million in revenue and above, an experienced M&A advisor running a structured process produces the best combination of pricing tension, deal certainty, and post-close protection.
Choosing Your Exit Route: Full-Service Advisory or M&A Platform
Two distinct routes match two distinct stages of the agency size spectrum. Both are run by FE International and are designed for technology-adjacent businesses, including digital marketing agencies.
For agencies under $1 million in revenue: the FE International M&A Platform
The FE International M&A Platform is built for both sides of the smaller-deal market. For sellers, it provides a curated listing environment where qualified buyers (individual acquirers, search funds, small operators, smaller PE firms) can review and submit offers without a full investment-bank-style process. For buyers, it provides direct access to a pre-vetted set of agency businesses under $1 million in revenue, with consistent disclosure standards and structured diligence.
The Platform makes sense for agencies in this size band because the economics of a full investment-bank-style process do not map well to deals at this scale. Buyer demand is real and deep, but the process needs to be efficient. The Platform's curated buyer network, standardized seller preparation, and integrated diligence tools compress timelines and increase the chance of multiple competing offers, which is what produces pricing tension. For buyers, the Platform centralizes access to qualified targets without the time and cost of running a proprietary deal-sourcing effort.
For agencies $1 million in revenue and above: FE International full-service advisory
For agencies above $1 million in revenue (and especially for agencies at or above $1 million in EBITDA), the full-service M&A advisory route adds value that materially exceeds its cost. FE International has completed more than 1,500 technology business transactions since 2010, with a 94.1% success rate on agency, SaaS, ecommerce, and content businesses. The senior advisors who run agency processes have closed deals across digital, staffing, insurance, and hybrid agency models, and the firm's transaction database underpins the valuation benchmarks used at the start of every engagement.
The full-service process starts with a free, no-obligation valuation. A senior advisor reviews the business, asks detailed questions about financials, operations, and the founder's goals, and delivers a valuation grounded in real transaction comparables. If the founder decides to proceed, FE prepares the confidential information memorandum, runs a structured marketing process to a curated set of qualified buyers (including PE platforms, strategic acquirers, and family offices), manages diligence through a secure deal room, and oversees closing through in-house legal. The 94.1% success rate reflects the structural advantage of running a process that creates real bidding tension and protects the seller through the legal and financial complexity of an eight-figure transaction.
How to choose between the two
The decision is largely about scale. Sub-$1 million revenue agencies typically have buyer pools, deal economics, and process complexity that fit the Platform. Agencies above $1 million in revenue and especially above $1 million in EBITDA benefit from the deeper buyer access, structured process, and post-close legal protection that the full advisory model provides. The free valuation step is the same in both cases. Founders considering an exit can start with that step and decide on route based on the resulting numbers and the founder's own objectives.
From Benchmark to Outcome
Digital marketing agency valuation in 2026 rewards preparation. The benchmark bands, the value drivers, the AI premium, the buyer-type matching, the deal structure work: each is a lever a founder can pull. Agencies that pull these levers intentionally over 12 to 24 months typically exit at 1.5x to 2x the multiple of agencies that go to market unprepared, on the same underlying earnings base. For buyers, the discipline is the mirror image: identifying targets where the work has been done, the metrics are clean, and the pricing reflects current 2026 comparables rather than legacy rules of thumb.
The 2026 market backdrop is the strongest agency M&A has seen in years. Capital is available, strategic acquirers are active, AI has shifted from uncertainty to tailwind, and the Omnicom-IPG merger has triggered a reshuffling that creates opportunity throughout the size spectrum. Both buyers and sellers have reasons to engage now rather than wait.
The next step is a valuation. For agencies above $1 million in revenue, get a free, confidential valuation from FE International. A senior advisor will review the business, identify the value drivers and detractors that will most affect a multiple, and deliver a valuation backed by real 2026 transaction comparables. For agencies under $1 million in revenue, list with or browse the FE International M&A Platform to connect directly with a curated network of qualified buyers and sellers. Both routes start with the same step: knowing what the agency is actually worth in the current market.