

Agency Valuation Multiples in 2026: Marketing, Creative, and Dev Shop Benchmarks

Agency valuation multiples in 2026 run from roughly 2.5x adjusted EBITDA for small, founder-led shops to 12x for scaled platforms, with most lower-middle-market marketing, creative and software development agencies clearing 4x to 8x. Recurring retainers, client diversification, a leadership bench and real specialization decide where an agency lands, and earn-outs are standard.
Global advertising revenue passed $1 trillion for the first time in 2025 and is on course for $1.4 trillion by 2030. Global M&A is on pace to clear $5 trillion in 2026, a first. And the agency world's largest acquirers have spent the year buying capability: Publicis agreed to pay $2.167 billion for LiveRamp in May, Accenture Song picked up creator agency Whalar in June, and Omnicom is integrating IPG after closing the largest merger in advertising history in late 2025.
That is the backdrop for every founder asking what their agency is worth right now. The short version is that agency valuation multiples are set by risk, not by revenue. Two agencies with identical earnings can sell three turns of EBITDA apart because one has retainers, a diversified client list and a managing director who runs the business, and the other has projects, two anchor clients and a founder who closes every deal.
This is the fourth page in our valuation multiples series, alongside SaaS valuation multiples and ecommerce valuation multiples. It covers the benchmark ranges by agency type and size, the value drivers that move the number in both directions, and the part of agency deals that gets the least attention and causes the most surprises: earn-outs. If you want the full methodology for a single agency type, our digital marketing agency valuation guide goes deeper on that model. This page is the cross-type benchmark.
What Are Agency Valuation Multiples and How Are They Calculated?
An agency valuation multiple is the number a buyer applies to your earnings to arrive at enterprise value. For almost every marketing, creative, PR, media or software development agency, the earnings figure is adjusted EBITDA (earnings before interest, taxes, depreciation and amortization, after normalizing adjustments). The formula is simple:
Enterprise value = adjusted EBITDA x multiple
The work is in the two inputs. The multiple comes from comparable transactions in your agency type and size band, then moves up or down based on the value drivers covered later. Adjusted EBITDA is where many founders leave money on the table, because the figure on the tax return is rarely the figure a buyer prices.
Adjusted EBITDA: the number buyers actually price
Adjusted EBITDA starts with reported operating profit and adds back costs a new owner would not inherit: owner compensation above market rate, one-time legal or restructuring costs, personal expenses run through the business, and non-operating items. It also annualizes contracted revenue signed late in the trailing twelve months. Every add-back needs a paper trail, because a buyer's quality of earnings review will test each one. Our guide to EBITDA add-backs covers which adjustments buyers accept and which ones they strike.
SDE or EBITDA: which basis applies to your agency
Below roughly $500,000 in earnings, where the founder is also the lead strategist, salesperson and account director, buyers price on seller's discretionary earnings (SDE), which adds one full owner salary back. SDE multiples for agencies typically run 2x to 4x. Above that line, with a leadership team in place, buyers price on adjusted EBITDA. A useful conversion: an agency's EBITDA multiple is usually 0.7x to 0.8x of the equivalent SDE multiple, because the owner's replacement cost comes out of earnings first.
Revenue multiples: a sanity check, not a method
Revenue multiples show up when earnings are temporarily depressed by growth hiring, or as a floor check. Most agencies trade at 0.4x to 1.0x trailing net revenue, with the top of that range reserved for retainer-heavy books. For media agencies, the revenue figure is net revenue (fees and commissions), never gross billings, since pass-through media spend is carved out before any multiple is applied. For the public holding companies, advertising comparables trade at about 2.1x enterprise value to sales as of January 2026, a reminder that scale and diversification are what expand revenue multiples.
Agency value is adjusted EBITDA times a risk-adjusted multiple. Get the EBITDA right first, because every turn of multiple is applied to it.
What Multiples Do Marketing, Creative, PR, Media and Dev Shop Agencies Sell For in 2026?
The table below sets out the 2026 benchmark ranges FE International uses for lower-middle-market agency transactions, assuming $1 million to $5 million in adjusted EBITDA, a functioning leadership team and clean financials. They are anchored to our published size bands and cross-checked against current public comparables and Tier 1 deal data. Smaller, owner-operated shops sit one to two turns lower on an SDE basis; agencies above $5 million in EBITDA move one to three turns higher once holding companies and large private equity platforms enter the bidding.


A few patterns in that table are worth spelling out.
Performance marketing sits at the top of the pure-service group because its revenue is the easiest to underwrite. Clients can see return on ad spend monthly, so they stay, and buyers can model retention with confidence. Creative studios sit lower on average, and that has nothing to do with the quality of the work. Project revenue has to be re-won every quarter, so a buyer discounts it. The creative shops that clear 6x and 7x in 2026 have converted their best relationships into retained production or brand-management lines and can show the recurring share rising year on year.
The creative versus media comparison comes up constantly. Independent media agencies often look like the bigger business on billings, yet price on a far smaller net revenue base, and their multiples depend heavily on whether they own data and analytics capability or simply execute buys. The holding companies have made that preference explicit: Publicis paid a 29.8% premium for a data collaboration platform, not a media network.
Dev shops are the newest entrant to many agency buyers' shopping lists and the one most often mispriced by founders. A custom development firm billing time and materials on short projects is valued like a project-based creative agency. The same firm with half its revenue on retained engineering or managed services, a named specialization and reusable accelerators prices like a technology services business, and public computer services comparables trade around 14x EBITDA, which tells you where the ceiling sits as a dev shop scales.
In 2026 the gap between the lowest and highest agency type is roughly four turns of EBITDA at the same size. Revenue quality, not service category, explains most of it.
Marketing Agency EBITDA Multiples by Size: Boutique to Platform
Size is the single biggest determinant of the multiple, and the effect is not linear. It steps up each time the buyer pool widens. These are the 2026 size bands we publish for marketing agencies, and the logic carries across creative and development shops.
- Under $500,000 EBITDA: 2.5x to 4x (usually 2.5x to 3.5x on SDE). Buyers are individuals, search funds and small operators who need seller financing or an earn-out to close.
- $500,000 to $1 million: 3x to 5x. Lower-middle-market PE add-on platforms, family offices and strategic acquirers start to appear.
- $1 million to $2.5 million: 4x to 6.5x. PE roll-up platforms compete here, and the qualifying criteria for the top of the band are 60%+ retainer mix, 20%+ margin and no client above 15%.
- $2.5 million to $5 million: 5.5x to 8.5x. Competitive processes with multiple bidders become the norm, and specialization carries a full turn or more.
- $5 million and above: 7x to 12x. Holding companies and large PE platforms underwrite strategic premiums for capability-defining assets.

Why boutique agencies price below large ones
A boutique agency with $400,000 in SDE is a different asset from a 60-person agency with $3 million in EBITDA, even if both have excellent work and loyal clients. Buyer financing is thinner at the small end, founder relationships carry more of the value, and the number of buyers who can write the check is smaller. As an agency grows into the lower middle market, private equity platforms and strategics with cheap capital enter the process, and their ability to underwrite integration synergies is what lifts the band.
Public versus private agency multiples
Founders often anchor on public numbers, and the gap needs explaining. As of January 2026, public advertising companies trade at a 12.0x enterprise value to EBITDA median and computer services companies at 14.1x. Across strategic M&A globally, deal valuations have held at a median 11.6x EBITDA through mid-2026. Those are diversified businesses with thousands of clients, public liquidity and no key-person exposure. A private agency carries a size discount, a liquidity discount and a transferability discount, which is why the lower-middle-market bands sit at a third to two-thirds of public comparables. The encouraging part is that each of those discounts is something a founder can shrink before going to market.

What Is Driving Agency Valuation Multiples in 2026?
Agency valuation multiples track three things: how much money clients are spending with agencies, how much capital is chasing agency assets, and how buyers view the risk that AI reshapes delivery. All three point the right way for prepared sellers in 2026.
Client demand is growing and shifting toward measurable work
Internet advertising alone grew 12.2% in 2025 to $755.6 billion and is forecast to compound at 7.2% a year through 2030. Marketing budgets at large companies settled at 7.8% of company revenue in 2026, with 15.3% of those budgets now directed to AI initiatives and 70% of CMOs naming AI leadership a critical goal. The practical read for agencies: clients are spending, and they are spending where results can be measured, which is exactly where performance, data and AI-enabled agencies live.
Capital is abundant and buyers are capability-led
Strategic M&A value rose 36% year to date through mid-2026 and global deal value is on track for roughly $4 trillion this year on PwC's count, with buyers favoring fewer, larger, better-prepared targets. In the agency space specifically, the Omnicom and IPG combination reset the top of the market and sent mid-cap holding companies and PE-backed platforms looking for gaps to fill. Our agency and marketing M&A outlook tracks that consolidation in detail.
Interest rates, economic cycles and the multiple
Policy rates sit well below their 2023 and 2024 peak on the Federal Reserve's published target range, and that matters more for agencies than for most businesses, because the typical lower-middle-market buyer uses leverage. Cheaper debt widens the buyer pool at every size band. Across cycles, the broader pattern is that agency multiples compress when clients cut discretionary project spend and hold firm where revenue is contracted, which is the structural reason retainer-heavy agencies trade at a premium in every environment.
Digital transformation and the AI premium
The most important shift since the move from project to retainer revenue is how buyers underwrite AI. Through 2024, uncertainty about AI's effect on agency margins slowed deals. By 2026 the question has flipped: buyers pay a 1x to 2x premium for agencies that can show AI inside delivery, with documented hours-saved benchmarks, AI-native service lines with their own margin reporting and proprietary data, and they discount agencies in commodified service categories. Acquirers are also confronting what Bain calls the AI winner's paradox: every deal thesis now has to state how AI changes the target's business model. Sellers who answer that question before it is asked get priced as the winner.
Geography, history and the view into 2027
Geography matters less than it did. Cross-border agency deals are routine, with US buyers acquiring UK and European agencies and the reverse, and dev shops with nearshore or offshore delivery in Latin America, Eastern Europe and South Asia attract a specific class of buyer for exactly that reason. US dollar earnings from US clients still price at the top of each band, and emerging-market agencies with international client lists are closing the gap.
Historically, agency multiples peaked with the 2021 deal cycle, reset in 2023 and have rebuilt on firmer ground since. The 2026 picture is healthier than the peak because it rests on earnings and retention rather than momentum. Looking into 2027, the forces already in motion favor sellers who prepare: a record global deal cycle, holding companies reshuffling around data and creator capability, abundant private equity capital, and an AI premium that rewards documented workflows. None of that requires a forecast to act on.
Three tailwinds set 2026 agency multiples: growing and measurable client spend, a record deal cycle with capability-led buyers, and an AI premium that goes to agencies with evidence.
Which Value Drivers Move an Agency's Multiple Most?
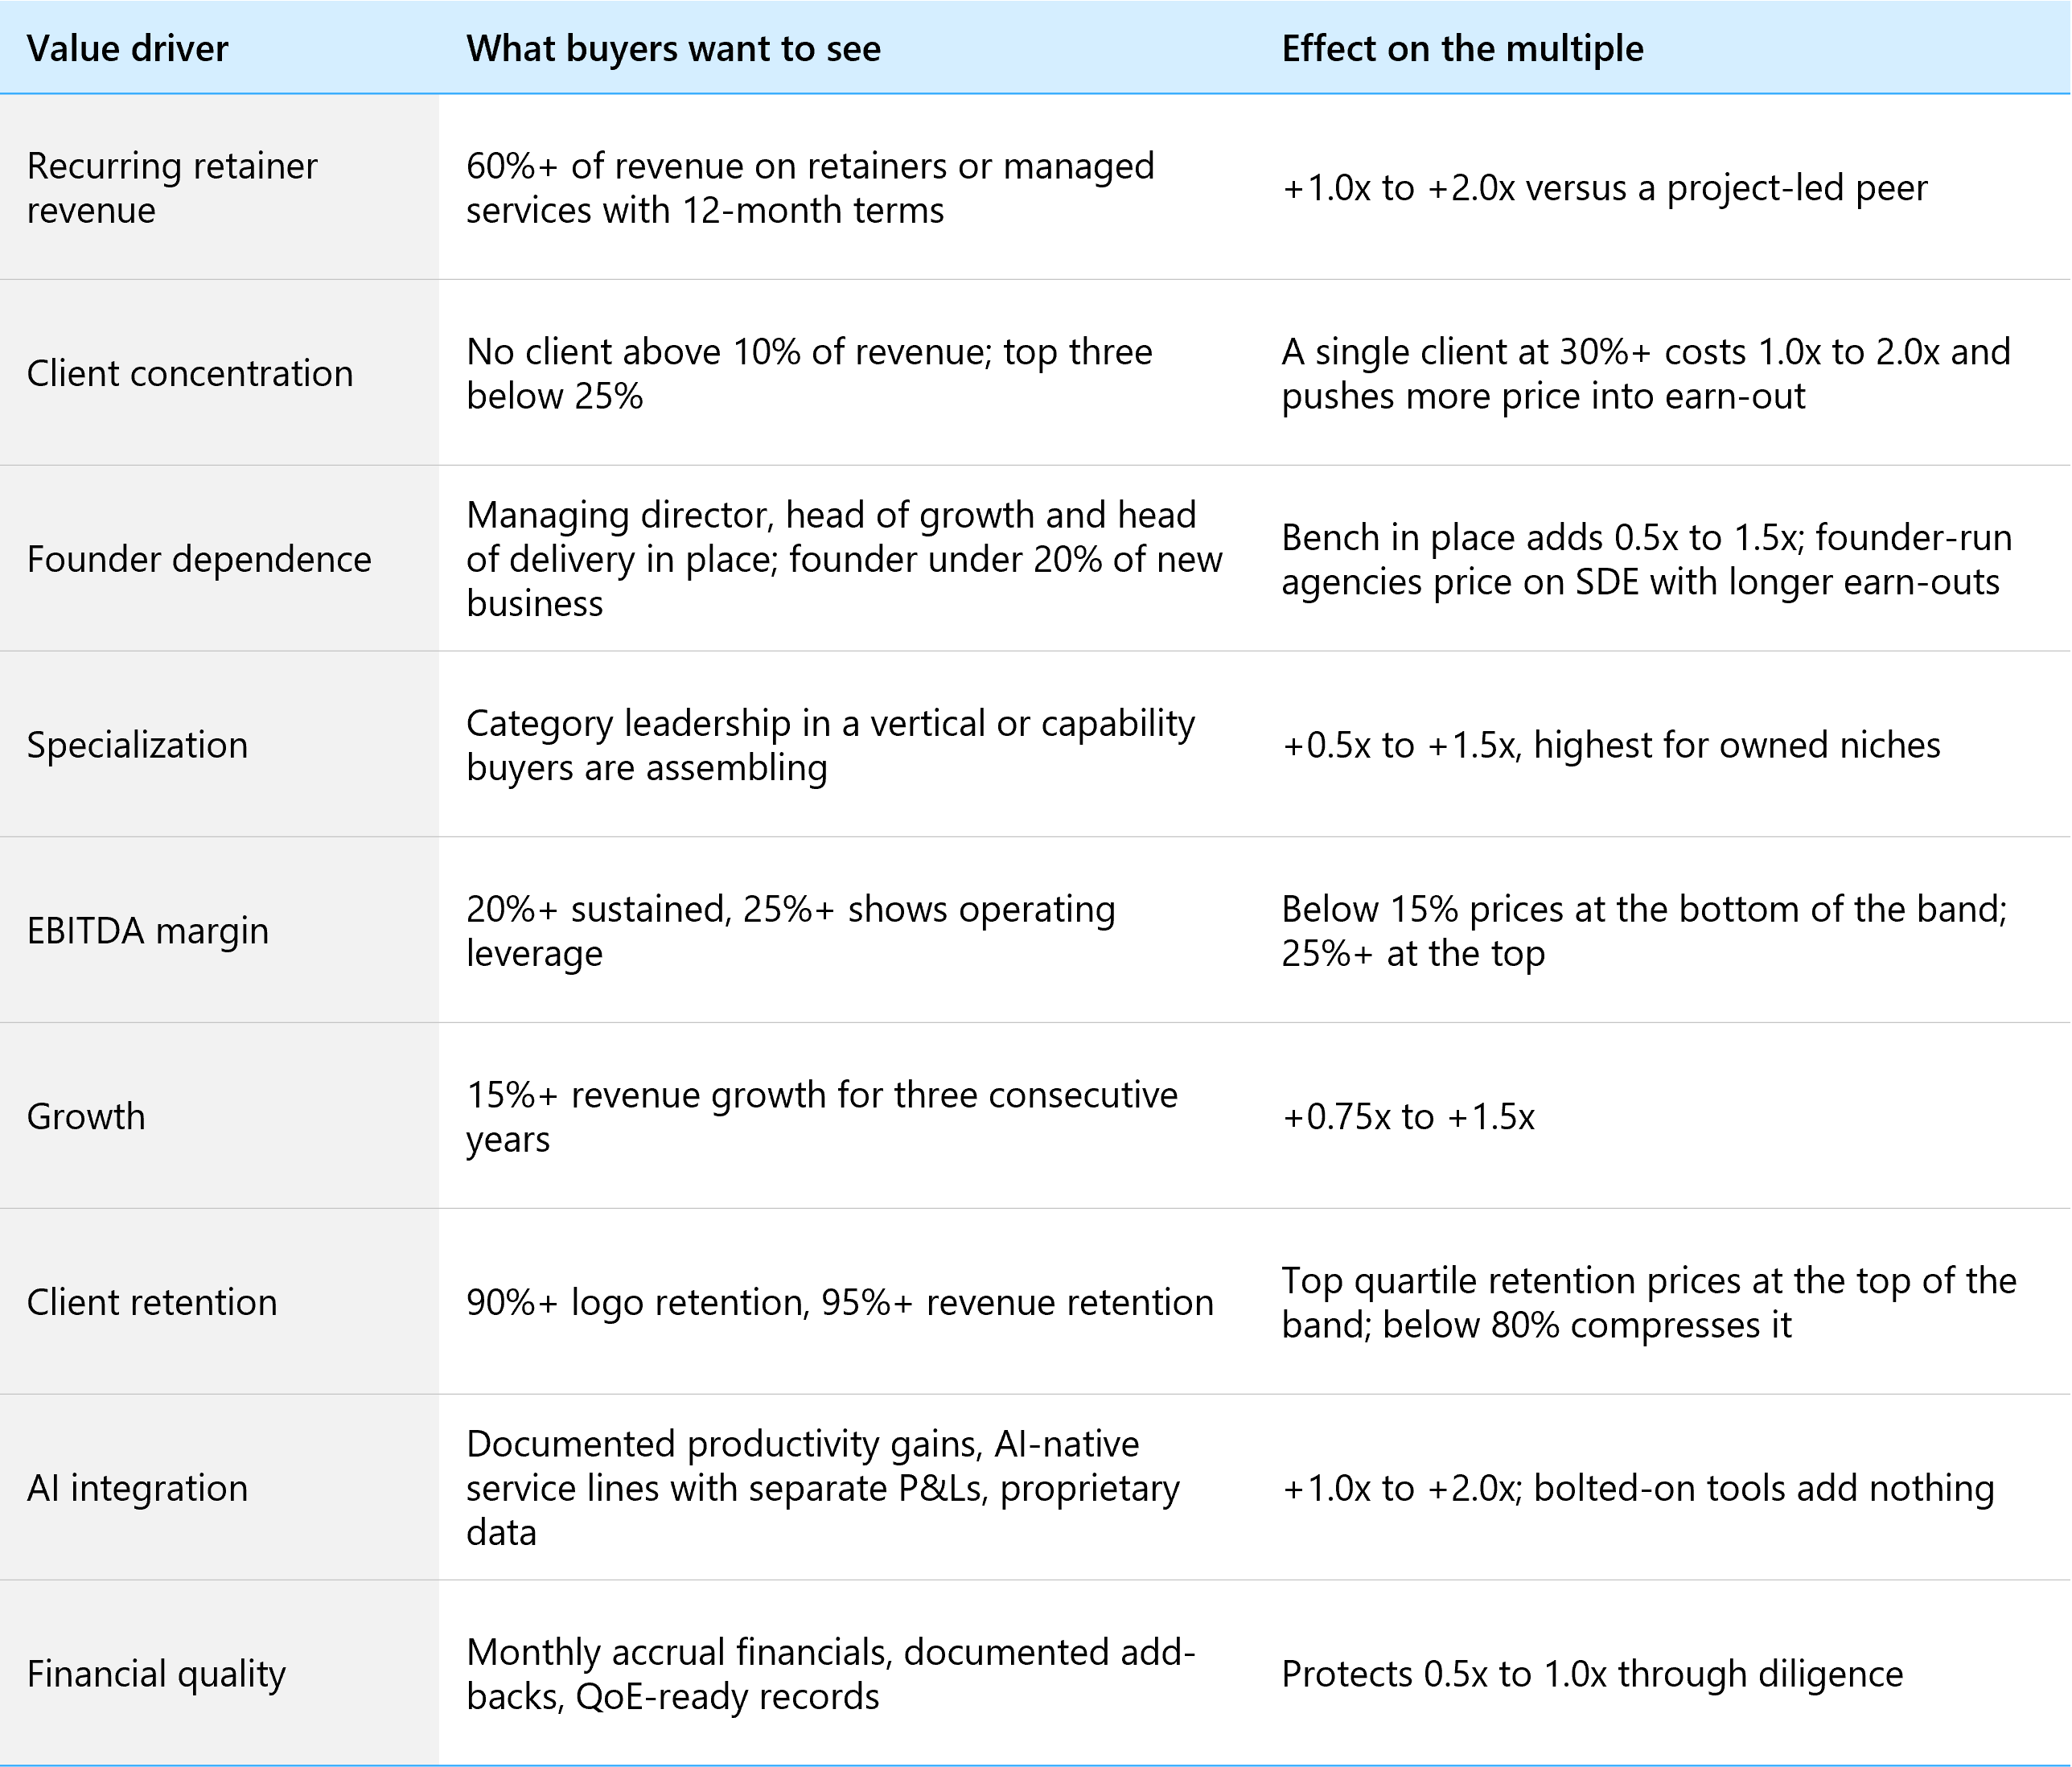
Within any size band, the spread between the bottom and top of the range is explained by a short list of drivers. This is the list buyers actually score, with the benchmarks they want to see and the effect each one has on the multiple in current deals.

How recurring retainers change the number
Retainers are the single most valuable characteristic an agency can show, because they turn a sales problem into a renewal problem. A buyer can underwrite a book where 70% of next year's revenue is already contracted; a book that has to be re-won every quarter gets priced on the risk that it is not. In our transactions, an agency with retainer revenue above 60% of mix typically commands one to two turns more than an otherwise identical project-based shop. Even partial conversion helps. Moving from 70% project to 50% project moves the multiple, and moving a creative studio's top ten relationships onto retained production can lift it a full band.
Why client concentration is the first thing buyers model
The first spreadsheet a buyer builds is the one where your largest client leaves the month after closing. If that client is 10% of revenue, the business survives it easily. If it is 35%, the underwriting model collapses, and the buyer responds with a lower multiple, a heavier earn-out tied to that client's retention, or both. Diversification is slow to fix and should be the first item on a pre-sale plan.
Founder dependence and transferability
Buyers underwrite the business that exists after the founder leaves. When the founder is the lead salesperson, the senior client relationship and the creative or technical authority, the buyer is acquiring a single point of failure and prices it accordingly: SDE basis, lower band, longer earn-out, longer transition commitment. A managing director with real P&L ownership, a head of growth who closes business the founder has never met, and documented delivery systems reverse every one of those effects.
Specialization and competitive advantage
A generalist agency competes on service quality against thousands of peers. A specialist in B2B SaaS, healthcare technology, legal services, retail media or fintech product engineering becomes a strategic target the moment a PE platform or holding company decides to enter that vertical. Specialization is also the simplest moat to prove in diligence: case studies, referenceable clients and a pipeline that comes to you.
Financial stability and earnings quality
Buyers underwrite the trend, not the trailing year. Three years of stable or rising EBITDA at a 20%+ margin reads as a durable business; a volatile earnings line, even with a strong final year, gets priced as a volatile business. Clean monthly accrual financials and a documented add-back schedule do not raise the multiple by themselves, but they protect it, because a quality of earnings review that strikes $200,000 of add-backs in a 6x deal removes $1.2 million of enterprise value.
Two agencies with the same $1.5 million of EBITDA can price at 3.5x and 7x. Retainers, concentration, bench, specialization and earnings quality account for the entire gap.
Why Are Earn-Outs So Common in Agency Deals?
Earn-outs are contingent consideration: part of the purchase price paid later, only if the agency hits agreed targets after closing. In most industries they are the exception. In agency M&A they are closer to the rule, and understanding why is the difference between a headline number and the cash that actually lands.
The data on earn-out prevalence
Across private-target M&A, earn-outs appeared in 24% of 2025 deals outside life sciences, up from 17% in the 2014 to 2022 period. The same dataset shows the pattern that matters for agency founders: earn-outs climb as deals get smaller, appearing in about 30% of deals valued at $50 million or less and 35% of deals at $25 million or less, and the median earn-out potential in those smaller deals reached 57% of the closing payment in 2025. Deals with private equity buyers carried earn-outs 24% of the time, nearly double the historical rate. Revenue is the most common earn-out metric, EBITDA the second, and most agency earn-outs combine a financial target with a client-retention test.

Agency deals sit above even those lower-middle-market figures. The clearest evidence comes from the acquirers themselves. Omnicom's 2025 annual report states that certain acquisitions include contingent consideration arrangements based on the future performance of the acquired businesses, with $214.9 million of earn-out liabilities on the balance sheet at year end and $95.8 million payable in 2026. WPP carried £46 million of contingent consideration due within a year and £20 million beyond it at the end of 2025, alongside put-option liabilities to agency founders. For the largest buyers of agencies in the world, earn-outs are not a negotiating tactic. They are an accounting line.
Why agencies specifically
Three structural features explain it. First, agency revenue is people-based and contract-light: most client agreements can be terminated on 30 to 90 days' notice, so a buyer cannot underwrite the client list the way it would underwrite a software subscription base. Second, key-person risk is concentrated in the founder and a few senior leads, and an earn-out keeps them engaged through the transition. Third, buyers and sellers routinely disagree on the value of the pipeline, and an earn-out lets both sides agree on a headline price without agreeing on the forecast.
What a typical agency earn-out looks like in 2026
In clean lower-middle-market agency deals, 60% to 70% of consideration is paid in cash at close, with earn-outs making up 10% to 20% of the price over one to two years. Where the agency has structural risk such as a client above 25% of revenue or a founder-run sales function, cash at close can drop to 50% and the earn-out can rise to 25% to 40%. Outside life sciences, the median earn-out performance period across private deals runs 24 months. The most common agency metrics are client retention thresholds (often 90% retention of the top ten clients), revenue against a budget set at signing, and EBITDA growth. PE buyers add equity rollover of 10% to 25% on top, giving the founder a second exit when the platform sells.
What actually gets paid
This is the part every seller should price in. In the deals the 2026 earn-out data tracks, 59% of earn-outs paid at least something, but only 21% of the total potential earn-out dollars were paid out, and lower-middle-market sellers with any achievement collected a median of 43 cents per potential dollar, against 67 cents in larger deals. Shorter measurement periods pay better than longer ones. The lesson is not to refuse earn-outs; a well-structured one is how an agency with concentration or founder risk gets to a top-of-band headline. The lesson is to treat the closing payment as the deal and the earn-out as upside, and to negotiate the terms that decide whether upside arrives.
How to negotiate an agency earn-out
- Tie the metric to what you control. Revenue or gross profit of your business unit, not consolidated EBITDA after the buyer's cost allocations.
- Keep the period short. Twelve to eighteen months aligns with the data on achievement; three-year earn-outs leave most of the money with the buyer.
- Define operating covenants. Budget, headcount, pricing and client assignment decisions during the earn-out should be yours or jointly agreed, with the buyer's obligation to run the business in good faith written into the agreement.
- Use graduated payouts, not cliffs. Hitting 90% of target should pay 90%, not zero.
- Protect against acceleration events. A sale of the buyer, a change in your role or a reorganization that moves clients off your P&L should accelerate the earn-out.
- Run a competitive process. Buyers who know they are bidding against others offer more cash at close and lighter earn-outs; that is where an advisor earns the fee.
Earn-outs appear in roughly a third of small private deals and in nearly all agency deals at the holding-company level. Expect one, negotiate its terms harder than the headline, and price in that only about a fifth of potential earn-out dollars are paid on average.
How to Value a Marketing Agency: A Worked Example
Here is how the pieces fit together for a hybrid digital and creative agency with $4.2 million in revenue, 28 staff and reported EBITDA of $700,000.
Start with adjusted EBITDA. The founder draws $300,000 against a $180,000 market rate for a managing director, a $120,000 add-back. A settled legal dispute cost $35,000 and will not recur. Family travel of $20,000 ran through the business. Adjusted EBITDA is $875,000.
Pick the band. At $875,000 the agency sits in the $500,000 to $1 million band at 3x to 5x. Now score the drivers. Retainers are 55% of revenue (good, not yet premium). The top client is 18% (acceptable, not clean). The founder runs sales and there is no managing director (the biggest drag). Margin is 21% and growth has averaged 12% for three years. The agency lands at roughly 3.75x, giving an enterprise value of about $3.3 million.
Now the structure. A PE add-on buyer offers $3.3 million with 70% in cash at close ($2.3 million), a 15% earn-out ($490,000) over 18 months tied to retaining the top ten clients and hitting a revenue budget, and a 15% equity rollover into the platform. Working capital is pegged at its trailing average, debt is repaid from proceeds and excess cash stays with the seller.
Finally, the comparison that matters. Had this agency spent the prior 18 months hiring a managing director, converting three more accounts to retainers (taking recurring revenue to 65%) and signing two clients that pulled the top account below 12%, it would have scored at the top of the band, around 4.75x, for an enterprise value near $4.2 million. Same earnings, nearly $900,000 more in value, and a lighter earn-out because the buyer's two biggest risks were gone. Our guide to valuing an agency business runs the same calculation across other agency types.
How Can You Raise Your Agency's Multiple Before You Sell?
Every driver in the table above is a lever, and the sequence matters because some take longer than others.
- Convert projects to retainers. Start with the ten relationships most likely to accept a monthly scope, and productize the services that recur. Report recurring revenue share monthly so the trend is visible to a buyer.
- Diversify deliberately. If one client is above 20% of revenue, the target is three new accounts in adjacent verticals before you go to market, with smaller individual contract sizes.
- Build the bench. Hire or promote a managing director and a head of growth, move client relationships to account leads, and document delivery in operating procedures a buyer can read.
- Make AI integration provable. Choose the two or three workflows where AI produces the largest measurable gain, record before-and-after benchmarks, and build named service lines with their own margin reporting.
- Clean the financials early. Move to monthly accrual accounts, document every add-back, and consider a sell-side quality of earnings report if EBITDA is above $1 million; it routinely protects more value than it costs. Our sell-side due diligence checklist lists what buyers will ask for.
- Track the metrics buyers score. Net revenue retention, logo retention, gross margin by service line, EBITDA margin trend and top-ten concentration, measured the way a buyer measures them, with at least four quarters of clean data before launch.
Agencies that work this plan typically exit at 1.5x to 2x the multiple of agencies that go to market unprepared, on the same earnings base. The preparation is also what shrinks the earn-out, because each item removes a risk the buyer would otherwise price in.
When Should You Sell Your Agency, and Which Route Fits?
The best time to sell an agency is when your fundamentals are at their strongest and the market is active, and both conditions hold in 2026. The signals founders tell us they look for are consistent: three years of stable or rising earnings, a leadership team that runs the business without you, a retainer share that has stopped climbing because you have converted what can be converted, and inbound interest from buyers you did not solicit. If you are waiting for the market to improve further, the data above suggests the cycle is already working in your favor; the bigger risk is going to market before the business is transferable.
The route depends on size. Agencies under $1 million in revenue are usually best served by a curated self-serve process, and the FE International M&A Platform connects owners at that scale with pre-qualified buyers directly. Above $1 million in revenue, and especially above $1 million in EBITDA, a structured sell-side process run by an advisor creates the bidding tension that moves both the multiple and the cash-at-close percentage. Either way, the first step is the same: an accurate valuation built on current comparables rather than a rule of thumb.
Turn Your Benchmark into a Number
Agency valuation multiples in 2026 reward exactly the things a founder can control: recurring revenue, a diversified client base, a team that runs the business, a specialization buyers are assembling, and evidence that AI is inside delivery rather than on the website. The benchmarks on this page tell you where your agency type and size band sit. The value-driver table tells you what moves you within the band. The earn-out data tells you how to protect the cash that lands at close.
The next step is to replace the range with a figure. FE International has advised on more than 1,500 technology business transactions since 2010 with a 94.1% success rate, and every agency engagement starts the same way: a senior advisor reviews your financials, scores the drivers above against current comparables and tells you what the business is worth today and what would move it. Get a free valuation, and find out which side of the range your agency is on.
