

Technology M&A Statistics 2026: 60+ Data Points on Deals, Multiples, and Exits

Technology M&A statistics for 2026 point to the second-highest deal value year on record. Technology deal value rose 67% to $420 billion in the first five months of 2026, technology accounts for 23% of all announced M&A, and AI features in nearly half of tech deals. Below are 60+ current data points, each linked to its source and refreshed quarterly.
Last updated: November 3, 2026. Next scheduled refresh: February 2027, once the full-year 2026 reports are published.
Technology M&A statistics measure what actually happened in mergers and acquisitions involving technology companies: how many deals were announced, what they were worth, the multiples paid, who bought, how long the process took, and how owners exited. The figures below come from the 2026 reports of the major consultancies, Big Four firms, market data providers and research houses, and every number links to its original publication.
This is a working reference, not a trend essay. We built it for two readers: the founder or owner weighing an exit, and the buyer trying to understand what competition looks like for the assets they want. Both ask the same five questions, so the page is organised around them: how much activity there is, what businesses are worth, who is buying, how long it takes, and how exits end up. For a narrative read on the first half of the year, our mid-year 2026 tech M&A report covers the same ground vertical by vertical.
How this page is compiled
Every statistic links to its original publisher. We use primary reports only, refresh the page each quarter when new data lands, and keep the period and the provider visible on every line because data providers count differently (announced versus completed deals, with or without minority stakes, global versus US). Where two providers disagree, we show both figures with their periods rather than blending them. Each section opens with the headline M&A statistics 2026 has delivered so far, followed by the full numbered list and a quick-reference table. One more caveat: the headline totals are shaped by a handful of very large transactions, so we flag where mid-market activity tells a different story.
How much technology M&A activity is there in 2026?
The short answer: more deal value than any year except 2021, spread across fewer transactions. Global M&A deal value rose 40% to $4.9 trillion in 2025, and the first five months of 2026 ran 41% ahead of that pace. Technology is the largest sector in the mix. For a buyer, that means competition is real but concentrated at the top of the market. For a seller, it means a deep pool of capital is looking for well-prepared targets.
- Global M&A deal value reached $4.9 trillion in 2025, up 40%, the second-highest annual total on record.
- Technology M&A value rose 77% in 2025, propelled by AI-related assets such as Alphabet’s $32 billion purchase of Wiz and Palo Alto Networks’ $25 billion acquisition of CyberArk.
- Global M&A value climbed 41% to $2.4 trillion in the first five months of 2026, putting the full year on track for the second-highest total ever.
- Announced deal value hit $3.19 trillion between January and July 2026, up 36%, within reach of the January-to-July record set in 2021.
- More than 28,000 transactions were announced in those seven months, 10% fewer than a year earlier: fewer, larger deals are carrying the market.
- Technology is the largest M&A sector globally, at 23% of all announced activity in 2026.
- Global technology deal value rose 67% to $420 billion in the first five months of 2026; technology supplied 85% of TMT deal volume, 89% of TMT deal value and 15 of the 16 TMT megadeals above $5 billion.
- Technology deal value grew 74% in the Americas and 89% in EMEA, while Asia Pacific was the only region to grow both value (up 24%) and volume (up 20%).
- The first quarter of 2026 was the strongest Q1 since 2021 at $861.1 billion, up 9.7% year over year across 7,924 announced deals.
- Global M&A value rose 15% in the first eight months of 2026 and sat 11% above the ten-year average.
- 37 megadeals of $10 billion or more were announced in the first eight months of 2026, up from 24 a year earlier and above the previous record of 32 set in 2021; 27 of the 37 involved a US buyer or target.
- Cross-border M&A reached $1.05 trillion through July 2026, the highest January-to-July total since 2007.
- Europe was the most targeted region for cross-border deals in Q1 2026 with 986 inbound transactions, and US buyers led cross-border activity with 409 deals, 213 of them for European assets.
- North America accounted for more than half of global deal value in the first eight months of 2026, with US targets at $1.1 trillion, or 54% of global activity; European deal value rose 43% to $541 billion, led by the UK at $178 billion (up 85%).
- 74 megadeals above $10 billion were announced between January 2025 and May 2026, and both the number and value of megadeals grew year over year.
- Technology deals accounted for 72.2% of US TMT disclosed deal value in Q1 2026, with private equity leaning toward fewer, larger plays.
- US M&A volume rose 9% from July through September 2026, with 155 technology deals above $100 million (up 11.5%) as buyers favoured mid-sized transactions.
- US technology, media and telecom deal value rose 20.6% year over year to $225.6 billion in Q2 2026 across 1,332 deals, with technology deal value up 49.3%.
- Global M&A is on pace to surpass $5 trillion for the first time, with the third quarter’s largest deal, Prologis’ acquisition of SEGRO, coming in at $18.8 billion.
- US venture investment reached $515.8 billion through the first three quarters of 2026, roughly 44% above the full-year record set in 2021, with AI capturing 82.7% of deal value.
Technology buyers announced $420 billion of acquisitions in the first five months of 2026 alone, a 67% increase, and technology accounts for 23% of the $3.19 trillion of global M&A announced through July.


What are the largest tech acquisitions of 2026?
The year’s biggest technology transactions show where strategic conviction sits: AI, cybersecurity, developer tools, payments infrastructure and the satellite layer of connectivity. The ten largest deals announced or completed in 2026, all drawn from the deal tables of the major reports:
- SpaceX’s $250 billion acquisition of xAI was the largest deal of Q1 2026 and accounted for nearly 30% of global deal value in the quarter.
- SpaceX’s $60.0 billion purchase of Anysphere, the maker of Cursor, topped the US TMT deal table for Q2 2026.
- The $55 billion take-private of Electronic Arts by a syndicate of investors is the largest private equity deal in history.
- Alphabet’s $32 billion acquisition of Wiz and Palo Alto Networks’ $25 billion acquisition of CyberArk are the two largest cybersecurity deals of the cycle.
- Fox’s $22 billion acquisition of Roku led platform consolidation in Q2 2026, alongside Amazon’s $11.6 billion deal for Globalstar, Intel’s $14.2 billion Fab 34 transaction and Rocket Lab’s $8.0 billion deal for Iridium.
- Stripe agreed to pay roughly six times OpenRouter’s $1.3 billion Series B valuation, set only three months earlier, in a cash-and-stock deal reported at about $8 billion.
- Hg’s $6.4 billion take-private of OneStream shows public-to-private deals still clear when a buyer sees a path to accelerate AI product innovation.


Who are the most active strategic acquirers in technology?
The buyers behind these numbers fall into five groups: Big Tech (Alphabet with Wiz, Amazon with Globalstar), the chip and compute layer led by NVIDIA, established software companies (Palo Alto Networks, ServiceNow, IBM with its acquisition of Confluent), the frontier AI labs, and a newer fifth category of cash-rich platform companies typified by Stripe. Google was the most active dealmaker in Q1 2026, buying ready-made capabilities from companies founded four to six years ago. For sellers, that list is the buyer map: each group pays for something different, and a competitive process is how you find out which one values your business most.
How is AI reshaping tech acquisition statistics?
AI is no longer a category inside technology M&A. It is the reason most of the large deals exist, and it is changing who buys, how fast they move and what they pay.
- Nearly half of all technology deals in 2025 involved an AI component, up from one in four in 2024.
- Big tech acquirers bought AI companies an average of 4.5 years after founding in Q1 2026, against 7.6 years across all AI M&A.
- AI companies accounted for a record 15.4% of all US M&A and IPO exits in Q1 2026, alongside a record 21 AI IPOs.
- Alphabet, Amazon, Meta and Microsoft are expected to spend more than $700 billion on AI infrastructure in 2026, which is pushing access deals, minority stakes and capacity agreements alongside outright acquisitions.
- 45% of executives used AI tools in M&A in 2025, more than double the prior year, and about one in three dealmakers now use AI systematically or are redesigning processes around it.
- Leading integration teams are confirming cost synergies two to three times faster with AI than outside-in diligence suggested.
- M&A, rather than IPOs, is emerging as the primary exit path for AI startups while public listings stay selective.
What acquirers actually pay for AI-native businesses, and how they diligence them, is covered in our AI M&A trends analysis.
AI sits inside nearly half of technology deals, and the buyers moving fastest are acquiring companies barely four years old.
What are technology M&A valuation multiples by vertical in 2026?
Multiples held firm through the first half of 2026 at the top of the market, and the premium for quality widened. The pattern across verticals is consistent: scale, recurring revenue, proprietary data and a credible AI story command the premium, and well-prepared businesses of any size can clear at strong prices.
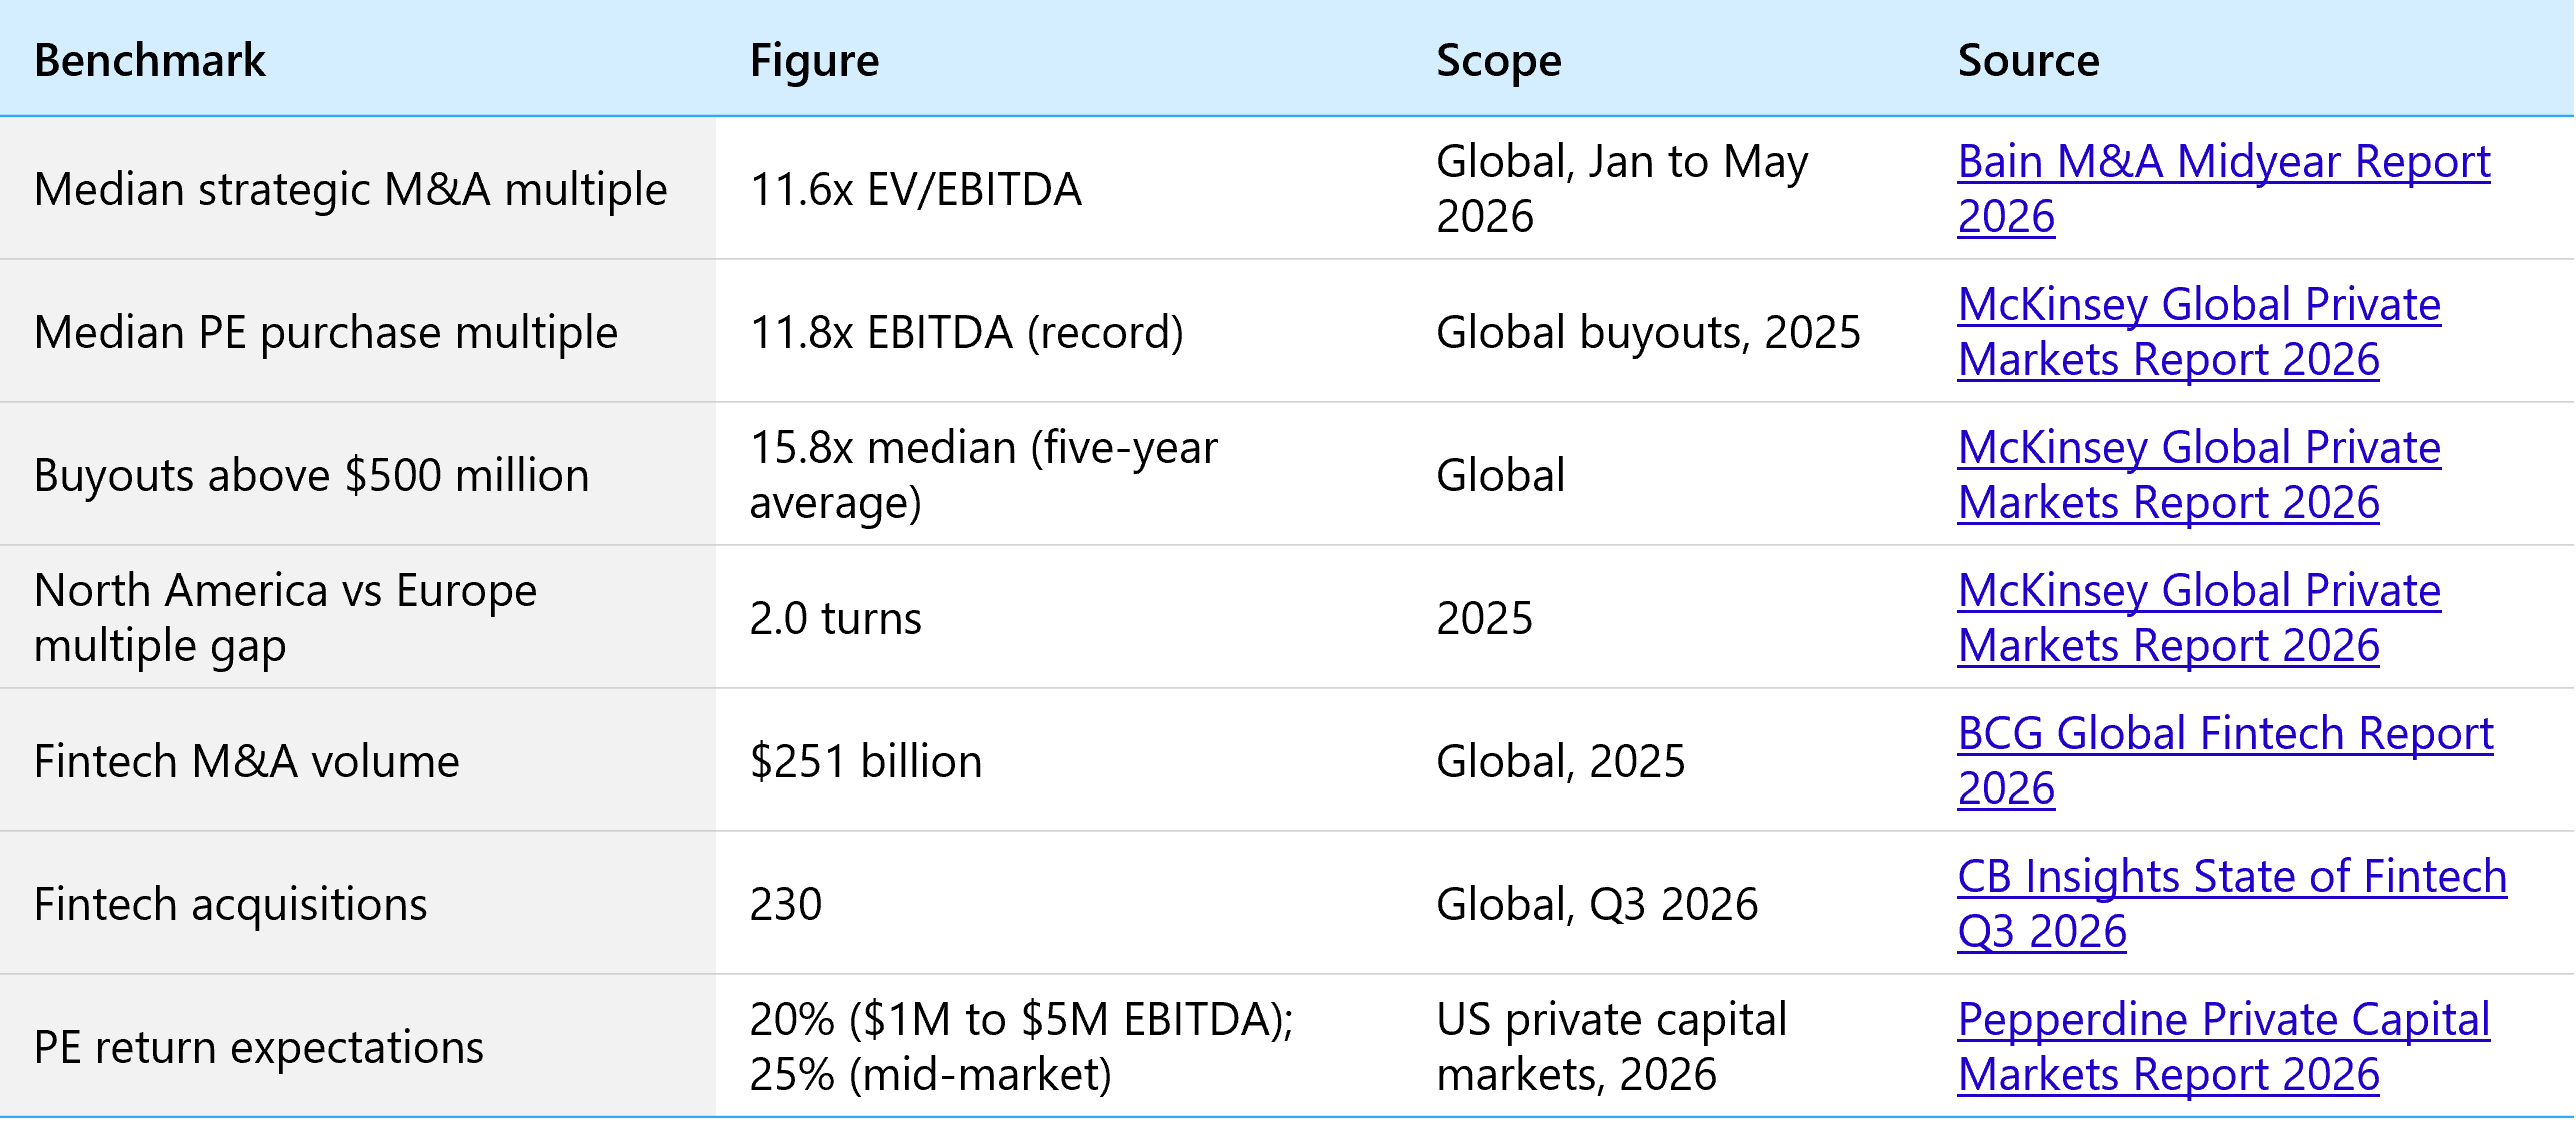
- The median strategic M&A multiple held flat at 11.6x EV/EBITDA through the first five months of 2026 even as deal value rose 36%.
- Private equity buyers paid a record median 11.8x EBITDA in 2025, up from 11.3x in 2024.
- Size commands a premium: the average median multiple for buyouts above $500 million was 15.8x over the last five years, against 11.5x for all deals.
- The multiple gap between North America and Europe widened to 2.0 turns in 2025, which is drawing buyers to quality European assets at lower entry prices.
- Technology buyout deal value rose 29% in 2025, one of the three fastest-growing sectors alongside healthcare and energy.
- Fintech: global fintech revenues reached $504 billion in 2025, up 22%, fintech M&A volume climbed to $251 billion from $184 billion in 2024, and equity funding rose 53% to $58 billion.
- Fintech consolidation continued with 230 fintech acquisitions in Q3 2026, led by Vanguard’s acquisition of Altruist at a $4.6 billion valuation, plus nine new fintech unicorns in the quarter.
- Fintech listings reopened as well: fintech IPOs rose 50% year over year to 42 in 2025, and 74% of the largest public fintechs are now profitable.
- Cybersecurity: the $32 billion Wiz and $25 billion CyberArk deals set the valuation ceiling; the mid-market benchmarks are in our cybersecurity M&A guide.
- Software: buyers are re-rating software around whether a business is AI-native, AI-resilient or AI-exposed, paying up for defensible data, embedded workflows and high switching costs.
- For buyers, US technology entry valuations in Q2 2026 were the most attractive since 2013 while total tech deal value still rose 49.3%, a combination that rewards sellers who can show defensible data and recurring revenue.
- Semiconductors and AI infrastructure: Analog Devices’ $1.5 billion deal for Empower Semiconductor and SiTime’s $1.5 billion deal for Renesas’ timing business show buyers paying for the components that let AI systems scale.
- EdTech: venture funding reached $1 billion in the first half of 2026 with deal volume stable, as investors concentrated on workforce and K-12 learning.
- Consumer and ecommerce: US consumer products and retail deal count doubled to 16 in Q3 2026 among transactions above $100 million.
- Private equity investors expect returns of about 20% for companies with $1 million to $5 million in EBITDA, rising to 25% for mid-market companies: that is the hurdle a seller’s price has to clear.
Who is buying technology companies in 2026? Strategic buyers vs private equity
Strategic buyers set the pace in 2026 while private equity rebuilt its pipeline. That mix matters for sellers because a strategic buyer can underwrite synergies that a financial buyer cannot, and it matters for buyers because sponsor competition was lighter in the middle of the year than at any point in recent memory.
- Strategic M&A value rose 36% year to date in 2026 while financial sponsor deal value declined 9%.
- In US technology, media and telecom, strategic deal value rose 52.1% year over year in Q2 2026 as private equity paused, leaving strategics with less competition for assets.
- US corporate M&A deal volume is projected to rise 11% in 2026 with private equity flat; corporate deal volume rose 22% in Q1 2026.
- Sponsor-backed M&A deal value still grew 11% in the first eight months of 2026, led by stronger PE activity in Europe and North America.
- Private equity deal value rose 19% to $2.6 trillion in 2025, with buyout value up 20% to nearly $1.8 trillion.
- Buyout deal value excluding add-ons jumped 44% to $904 billion in 2025, and the industry entered 2026 with $1.3 trillion of dry powder.
- More than 40% of that dry powder has been available for two years or more, a record that pushes sponsors to deploy.
- Take-private value rose 43% in 2025, and 72% in North America to $240 billion.
- Technology, media and telecom attracted the largest share of global PE investment through Q3 2026 at $479.1 billion across 4,508 deals.
- Global private equity investment stood at $1.5 trillion after the first three quarters of 2026, with a rolling twelve-month total of $2.1 trillion.
- 77% of limited partners plan to maintain or increase their buyout allocations over the next three years, and about 70% plan to maintain or increase PE deployment in 2026.
- Among entrepreneurs planning an exit, 40% expect to sell to a strategic buyer in their industry, 23% to pass the business to the next generation and 13% to sell to a financial investor.

Strategic buyers are the price-setters in 2026 technology M&A; private equity is the capital in waiting, with $1.3 trillion of buyout dry powder and a record share of it two years old.
How long does a technology M&A deal take in 2026?
Timelines run on three clocks: how long a buyer takes to decide, how long a transaction takes to close and integrate, and how long an owner has held the business before selling. The 2026 data shows that prepared sellers are the ones moving fastest.
- Large deals can take 36 months or more from announcement to full integration, which is why integration planning now starts before signing.
- The average private equity holding period stretched to 6.6 years, against 6.1 years between 2011 and 2020, and 52% of buyout-backed companies have now been held four years or longer.
- The median holding period for US portfolio companies sold by PE firms rose to 5.3 years in 2025 from 4.3 years in 2020; in Europe it rose from 4.6 to 5.8 years, and roughly one-third of PE-owned assets have been held for more than seven years.
- Private equity firms held more than 33,500 unsold portfolio companies as of June 30, 2026, more than double the level of a decade ago: a deep pipeline of future sellers.
- Big tech buyers acquired AI companies an average of 4.5 years after founding in Q1 2026, about three years faster than the market average.
- Stripe agreed to buy OpenRouter three months after the company’s Series B, a sign of how quickly strategic buyers now move for AI assets.
- 32% of entrepreneurs are considering a business transition within five years, rising to 57% among owners aged 65 and over.
- Regulatory clocks are shortening: regulators are blocking fewer transactions and relying more on conditional approvals, which has produced fewer abandoned deals.
- Competition for high-quality assets and valuation gaps may continue to extend diligence and negotiation timelines, which rewards sellers who arrive with clean financials and a complete data room.
- 14% of sponsor-backed exits now go through continuation vehicles, a timeline tool that lets owners extend a hold without a full sale.


What do business exit statistics say about 2026?
Exits are where the 2026 story turns clearly positive for owners. Exit value is approaching record highs, information technology leads every other sector in the number of exits, and strategic buyers are back as the most important exit route.
- Global private equity exit value reached $481.6 billion in Q3 2026, up 65% quarter over quarter, across 1,089 exits (up 9.3%), with realizations approaching record highs globally.
- Information technology produced 428 private equity and venture exits in the first half of 2026, 60% more than industrials, the next-highest sector.
- IT also led the first quarter with 198 exits, and the quarter’s largest exit was SpaceX’s $250 billion acquisition of xAI.
- Global PE-backed exit value rose 41% to $1.3 trillion in 2025, the second-highest year on record, with IPO exits nearly doubling to more than $320 billion.
- Buyout-backed exit value jumped 47% to $717 billion in 2025, the second-best year ever, as sales to corporate buyers regained importance.
- The median PE-backed company now exits at 0.3 turns of EBITDA above its held value, and A-grade assets exit 1.6 turns higher.
- IPOs made up only 5% of PE-backed exits by count in 2025 but 23% of exits above $500 million, which means the public route is a large-company option and a sale is the route for everyone else.
- Just 18 companies went public in Q3 2026 while 992 active unicorns carry a combined $5.7 trillion valuation, which keeps M&A the realistic path to liquidity for most technology companies.
- 63% of US entrepreneurs are considering exiting their business, compared with 38% in Europe and 18% in Asia Pacific.
- 64% of sellers had done no formal exit planning before going to market, and only 26% had met with any advisor: the single biggest gap between a seller’s price and the market’s.
- At FE International, 94.1% of the businesses we take to market close, across more than 1,500 completed transactions with a combined value above $50 billion.


Exit value is back near record highs, IT leads every other sector in exit count, and the sellers who leave money on the table are the ones who never planned.
For SaaS owners, our guide to selling a SaaS business walks through the preparation that moves the multiple before a buyer ever sees the numbers.
What is the technology M&A outlook for the rest of 2026 and 2027?
Every major forecaster expects the year to finish strong. The full-year estimate of $5.3 trillion would make 2026 the second-highest year on record, global M&A is on pace to pass $5 trillion for the first time, and US deal volume above $100 million is projected to grow 8% in 2026. Sentiment is improving too: the global M&A sentiment index rose to 83 from 79 at the start of the year, more than 80% of private equity and corporate dealmakers expect to transact more deals at greater aggregate value over the next 12 months, and 80% of M&A executives expect to sustain or increase deal activity in 2026.
The second-half themes are already set: access to the AI ecosystem over narrow capability buys, strategic buyers continuing to lead while private equity waits for valuations to rationalise or for limited partners to press for exits, and a broadening recovery that depends on more transaction-ready assets coming to market. That last point is the opportunity for owners. The constraint in 2026 is not capital or buyer appetite; it is the supply of well-prepared businesses that buyers can underwrite with conviction.
What the 2026 technology M&A statistics mean for your next move
Read together, the numbers describe a market with abundant capital, selective buyers and a shortage of prepared sellers. Technology deal value is up 67% in 2026, strategic buyers are paying an 11.6x median multiple with premiums for scale and AI relevance, exit value is approaching record highs, and most of the 2027 pipeline sits in private equity portfolios and founder-owned companies that have yet to plan.
For buyers, the best entries are in the middle of the market, where deal volumes remain below long-term averages and competition from sponsors eased in 2026. For owners, the edge is preparation: the 64% of sellers who went to market without an exit plan are the ones who leave value behind. FE International has completed more than 1,500 technology transactions with a 94.1% success rate and more than $50 billion in combined value, and that data set sits behind every valuation we produce. If you want to know where your business sits against the benchmarks on this page, get a free valuation and we will show you the numbers that apply to your company, your vertical and your buyer pool.
